Curated OER
Exponential Decay
Students study exponential decay and its application to radiocarbon dating. In this exponential decay lesson, students use candy to model the time it takes for something to decay. Students also graph the data they collect and...
Curated OER
Worksheet Six: System of Equations
In this system of equations worksheet, students solve systems of equations. They plot functions and evaluate solutions as floating point numbers. This two-page worksheet contains 8 multi-step problems.
Kenan Fellows
Half-Life
Scholars shake their way to understanding half-life with the help of candy. They observe and record which side candy lands on to graph the exponential decay in the fifth lesson of seven integrating chemistry and algebra. Combining...
Curated OER
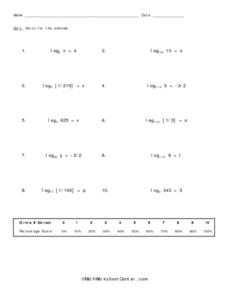
Quiz: Solve for the Unknown - Logarithms
In this logarithm learning exercise, students solve for the unknown. With the assistance of a graphing calculator, they identify the value of one variable. This one-page learning exercise includes ten problems which contain one...
Achieve
Spread of Disease
Viruses can spread like wildfire, and mathematics can model the speed of infection. Given a function, scholars analyze it to describe the spread of a disease within a stadium. Learners find the initial number infected and the maximum...
Illustrative Mathematics
Modeling London's Population
Looking at London's population from 1801–1961 in 20 year increments, high school mathematicians determine if the data can be modeled by a given logistic growth equation. They explain their thinking and determine the values of each...
Curated OER
Inverse of Logarithms
In this algebra instructional activity, students define inverse functions and solve for the inverse of logarithmic equations. There are 20 logs and graphing questions with an answer key.
Curated OER
Worksheet #12 - Logarithms
In this worksheet, learners convert exponential expressions into an equivalent logarithm and visa versa. They find the exact value of logarithmic expressions and determine the domain of a given function. Finally, students use...
Curated OER
Classifying Functions
Eleventh graders sort different types of functions including rational, periodic, exponential, polynomial, quadratic, logarithmic and linear using "function cards." The functions are displayed in multiple representations including...
EngageNY
End-of-Module Assessment Task - Algebra 2 (Module 3)
The last installment of a 35-part series is an assessment task that covers the entire module. It is a summative assessment, giving information on how well pupils understand the concepts in the module.
Curated OER
Will Exams Be Cancelled?
If the flu outbreak continues, exams will have to be canceled. Investigate the properties of exponential and logarithmic functions. In this algebra lesson, students use the TI to examine and differentiate between exponential growth and...
Curated OER
What is Log?
Young mathematicians differentiate between logs and natural logs in this algebra lesson. They solve functions and logarithmic functions. Learners also graph and rewrite the exponential and log functions.
Curated OER
Exponential Transformations
Perform transformations on exponential functions! Teach your class how to perform dilation, compression, and translation. They graph exponential functions using the TI Calculator.
Curated OER
Worksheet 28 - Spring 1996
In this math activity, students examine the graph in polar coordinates of r = f(θ). Then they sketch a graph of the modified functions indicated.
Curated OER
Mathematics B: New York High School Test
For this mathematics worksheet, students solve problems pertaining to high school mathematics. Problems include topics such as finding the sine, cosine and tangent. They graph functions, work with statistics, solve measurement problems,...
Curated OER
Vertical and Horizontal Translations
Students analyze function graphs. In this Algebra II/Pre-calculus instructional activity, students investigate the graph of a function as they determine to which family of functions it belongs, determine the parent function and...
Curated OER
PreCalculus: Final Examination
In this final examination worksheet, students find the tangent function and sine function. They graph problems on a polar coordinate. Students describe trigonometric properties. This twelve-page worksheet contains 80...
Curated OER
Algebra II: Exponential Functions
Students investigate, describe, and predict the effects of parameter changes on the graphs of exponential functions; describe limitations on the domains and ranges of these functions; and examine asymptotic behavior.
Curated OER
Exponential vs. Power
Pupils differentiate between exponential and power functions. They identify the base, exponent and properties of exponential functions. They also graph the functions using the TI calculator.
Curated OER
Exploring Quadratic Equations
By stretching and translating the parabola given and determining the effects on the equation, students explore finding the vertex and zeros of a parabola and relate them to the equation. Students also view the intercept form to determine...
Curated OER
Linear and Exponential Models
Students linearize data to determine if an exponential model is suitable. In this linearizing data to determine if an exponential model is suitable lesson plan, students graph the residuals of sets of data that appear to have an...
Curated OER
Charging Up, Charging Down
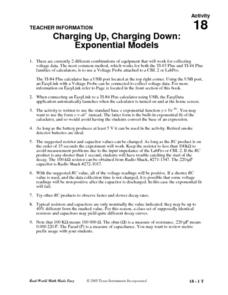
Learners collect and analyze voltage data. Then, they investigate exponential functions using the TI and a Voltage Probe and graph their data and analyze it using a table.
Curated OER
Buying Cars/Financing Cars Compound Interest
Provide a real world context in which exponential functions are used to determine a eal world phenomena such as compound interest and exponential growth. This lesson should be taught after learners have mastered the laws of exponents and...
Radford University
A Change in the Weather
Explore the power of mathematics through this two-week statistics unit. Pupils learn about several climate-related issues and complete surveys that communicate their perceptions. They graph both univariate and bivariate data and use...


