Curated OER
Central Tendency
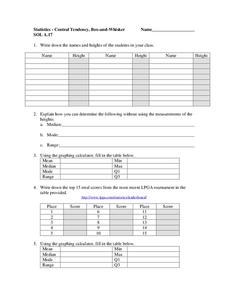
In this central tendency learning exercise, students solve and complete 10 different problems that include measures of central tendency. First, they write down the names and heights of students in their class. Then, students explain how...
Curated OER
Stem and Leaf Plots
In this measures of central tendency worksheet, students study a stem and leaf plot pertaining to weekly low temperatures. Students use the plot to answer 6 questions. There will be a question that requires students to make their own...
Curated OER
Family Activity: Bar Graphs and Line Graphs
For this math worksheet, students work at home with a family member on a graphing activity. Students count the number of cans, glass jars, boxes and bags in the pantry. Students make a bar and a line graph to represent the data.
Curated OER
Misleading Statistics
In this misleading statistics activity, students identify misleading graphs. They determine the mean, median and mode of given data. Students determine the measure of central tendency which accurately describes the data. This one-page...
Willow Tree
Box-and-Whisker Plots
Whiskers are not just for cats! Pupils create box-and-whisker plots from given data sets. They analyze the data using the graphs as their guide.
Curated OER
MAP Practice
In this geometry activity, students create circle, line and bar graphs using different comparisons of events. There are 24 questions with an answer key.
Curated OER
Statistics
In this statistics worksheet, students solve and complete 6 different problems that include determining various types of statistics. First, they determine the data set where the median value is equal to the mean value. Then, students use...
Curated OER
Statistics
In this statistics worksheet, 9th graders solve and complete 10 various types of problems that include using different types of graphs to illustrate data. First, they determine the median score for each stem-and-leaf plot. Then, students...
Los Angeles County Office of Education
Assessment For The California Mathematics Standards Grade 6
Test your scholars' knowledge of a multitude of concepts with an assessment aligned to the California math standards. Using the exam, class members show what they know about the four operations, positive and negative numbers, statistics...
Curated OER
What Are Your Favorite Apples?
In this tally worksheet, students take a survey to determine the favorite apple. They write tally marks beside the apple chosen. For elementary students, this worksheet may be used for counting purposes and to reinforce what a tally mark...
Curated OER
High School Mathematics Problems from Alaska: Fire Fighting Crew
Students apply mean, median and mode calculations of firefighter test scores to decide on hiring.
Curated OER
"M&M's"® Candies Worksheet 2
In this math worksheet, students plot the mean, median, and mode for the colors of M and M candies by filling in the graphic organizer.
Curated OER
Data Analysis
In this data analysis worksheet, young scholars solve and complete 4 different types of problems. First, they reduce the data provided to find the means, and graph the means in a line graph. Then, students graph the data from each...
Math Guy
Algebra 1 Practice Final
What makes this resource special? The amazing answer key that comes with worked out solutions and notes for each problem. Practice problems include all topics ranging from linear systems to simplifying exponential expressions. The...
Curated OER
Make and use a Stem-and-Leaf Plot
In this stem-and-leaf plot worksheet, students use a given plot to solve 4 problems, then make a plot for given data and solve related problems. Houghton Mifflin text referenced.
Curated OER
Drops on a Penny
A helpful worksheet describes an interesting demonstration on the surface tension of water. Learners guess how many drops of water the heads side of a penny will hold. This resource does a great job of describing just how a penny can...
Curated OER
Smarties Investigation
In this math worksheet, students complete a variety of activities using Smarties candy. For example, students estimate the number of each color, count the actual amount, and record their results in a tally chart.
Curated OER
Handling Data- Health Statistics
In this social studies worksheet, students organize 50 country cards into groups. Students analyze a chart and group countries according to lowest, middle, and highest Infant Mortality Rate.
Curated OER
"M&Ms"® Candies Worksheet 1
In this math worksheet, students find the likelihood of different outcomes with the use of M and M's candy for the seven questions and fill in the graphic organizer.
Other
Tulpehocken Area School District: Graphing and Analyzing Scientific Data
Student learning exercise with explanation of pie, bar, and line graphs, the parts of a graph, and the definition of mean, median, and mode. This summary is followed by an exercise for each type of graph within a scientific context.
Math Drills
Math Drills: Statistics and Probability Worksheets
Download these free worksheets to sharpen your skills with statistics and probability. Sheets focus on collecting and organizing data, measures of central tendency (mean, median, mode, and range), and probability.


