EngageNY
Structure in Graphs of Polynomial Functions
Don't allow those polynomial functions to misbehave! Understand the end behavior of a polynomial function based on the degree and leading coefficient. Learners examine the patterns of even and odd degree polynomials and apply them to...
Curated OER
Exponential Growth and Decay
Quiz your middle and high schoolers on solving exponential growth and decay. First, they evaluate for a variable given the second variables value. Then, they graph an equation that illustrates the exponential growth or exponential decay...
Curated OER
Profitable Soda Stand
Am I making any money? Help learners determine if their fictitious soda stand is turning a profit. They graph linear equations using the slope and y-intercept and identify the best price to use to sell soda. They identify the domain and...
Curated OER
Impossible Graphs
Students distinguish between possible and impossible graphs of functions, and to learn why some graphs are impossible. They have practiced plotting functions on the Cartesian coordinate plane
Curated OER
Reading Points on a Graph
For this reading points on a graph worksheet, students read and identify points on a coordinate plane. They place their answers in the form of an ordered pair. Students identify 20 points. They may enter their answers on the webpage...
Curated OER
Lines, Rays, Line Segments, and Planes
Students are introduced to lines, rays, line segments and planes. They explore the differences between lines, rays, line segments and planes. Students pracice graphing lines, rays, line segments and planes.
Curated OER
Variables and Patterns: Determining an appropriate scale while graphing
Sixth graders determine appropriate scales when graphing data. In this graphing lesson, 6th graders use an the applet "Graph It" to determine what is an appropriate scale for their data.
Curated OER
Coordinates on a Plane
In this coordinates on a plane worksheet, 9th graders solve and complete 9 different types of problems. First, they graph the given coordinates and respond to a number of questions. Then, students find the midpoint and the length of the...
Curated OER
Graphing Linear Equations
In this graphing linear equations worksheet, 9th graders solve and graph 10 different problems that include graphing on the given coordinate planes. First, they determine whether each equation is a linear equation and rewrite it in the...
Curated OER
Hitting the Slopes (Using the Graphing Calculator)
In this slope worksheet, students use graphing calculators to determine the slope of a line. They graph lines and identify characteristics of positive and negative slopes. This two-page worksheet contains four multi-step problems.
Curated OER
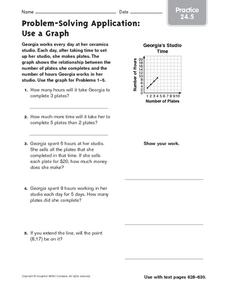
Problem-Solving Application: Use a Graph: Practice
For this graphing coordinates worksheet, students study the graph and the coordinates. Students then answer the five questions about the graph and show their work.
Curated OER
Graphing Functions
In this graphing functions worksheet, 10th graders solve 10 different problems that illustrate various graphs of functions. They determine the type of function that each graph shows. Then, students write the equation for the line graphed...
Curated OER
Hit the Slopes
Eighth graders work in one collaborative group to understand how ordered pairs are represented and graphed on a coordinate plane. They identify points on the coordinate plane and communicate their understanding of ordered pairs and their...
Curated OER
Worksheet 38-Spring 1996
In this math worksheet, students determine if the definite integral of given functions exist. They use a Taylor polynomial to approximate given values. Students express the arc length of a graph on a polar coordinate system as an integral.
Mathematics Vision Project
Module 2: Systems of Equations and Inequalities
The brother-sister pair Carlos and Clarita need your class's help in developing their new pet sitting business. Through a variety of scenarios and concerns presented to the siblings, the learners thoroughly explore systems of equations...
Virginia Department of Education
Inequalities
Compare graphing an inequality in one variable on a number line to graphing an inequality in two variables on a coordinate plane. Young mathematicians work on a puzzle matching inequalities and their solutions. They then complete a...
Curated OER
Number Pairs
As you introduce graphs and coordinate pairs, use this guided activity to get scholars started. They reference an example before recording number pairs to identify the location of 12 letters on a grid. Next, learners examine shapes on a...
Shodor Education Foundation
Multi-Function Data Flyer
Explore different types of functions using an interactive lesson. Learners enter functions and view the accompanying graphs. They can choose to show key features or adjust the scale of the graph.
EngageNY
Constant Rate
Two-variable equations can express a constant rate situation. The lesson presents several constant rate problems. Pupils use the stated constant rate to create a linear equation, find values in a table, and graph the points. The resource...
Shodor Education Foundation
Sequencer
Take the first step into graphing sequences. Learners set the starting number, multiplier, add-on, and the number of steps for a sequence. Using the inputs, the interactive calculates and plots the sequence on the coordinate plane. Users...
Schoolcraft College
Trigonometry
This trigonometry textbook takes the learner from a basic understanding of angles and triangles through the use of polar coordinates on the complex plane. Written by a mathematician-engineer, examples and problems here are used to...
Curated OER
Graphing Data
Students graph lines in a coordinate plane. In this geometry lesson, students graph lines on a coordinate plane, and identify the slope. They calculate the volume, area and perimeters of the shapes created on a coordinate plane.
Mathematics TEKS Toolkit
Grade 6: Exploring c/d = pi
Introduce your math class to the perimeter of a circle. Teach them that pi describes the relationship between the circumference and the diameter. As a hands-on investigation, pairs or small groups use string to compare these two values...
Curated OER
Coordinate Crunch
Students identify plots on a graph while playing a game on a large coordinate grid and then on smaller grids.


