Curated OER
Ellipses and Kepler's First Law
The class examines graphs in the form r = F(¿¿) in polar coordinates (r, ¿¿), in particular with the circle, ellipse and other conic sections. They determine the nature of an ellipse by studying the role of the semimajor axis and...
Curated OER
Plugging Into The Best Price
Examine data and graph solutions on a coordinate plane with this algebra lesson. Young problem-solvers identify the effect of the slope on the steepness of the line. They use the TI to graph and analyze linear equations.
Curated OER
Fishing for Points
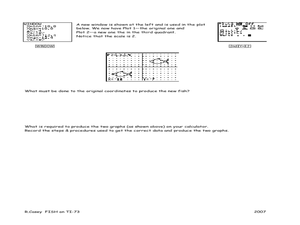
Learners explore the concept of ordered pairs. In this ordered pairs lesson, pupils list the ordered pairs of a graph in the shape of a fish. They use their calculator to translate the fish using lists, then translate the fish left,...
Curated OER
Intersecting Graphs
Ninth graders know how to solve a system of linear equations, but what happens when the system involves an exponential function? The instructional slideshow teaches viewers to determine solutions to systems of equations with linear and...
Curated OER
Discovering PI
In this pi worksheet, students identify and complete 4 different problems that include pi and graphing data points. First, they complete the chart at the top by measuring the diameter and circumference of each object. Then, students plot...
Curated OER
Rise Over Run
In this rise over run worksheet, learners solve and complete 2 different problems that include determining the rise over run for a race ran. First, they use the information in the table to graph each person's performance using a...
Curated OER
Perplexing Puzzles
Elementary and middle schoolers explore scatter plots. In this graphing lesson, pupils work in small groups and use jigsaw puzzles to develop a scatter plot. Younger learners may develop a bar graph.
Curated OER
Graphing Linear Equations
Ninth graders review the information that they have already learned
with regard to linear equations and graphical representations. They then assist in combining equations with a graphical element and complete various graphs with this...
Raytheon
Equations and Graphing Review
In this equations and graphing review instructional activity, learners write, graph and solve equations for 62 problems, including a mid-unit review, with answers included.
Curated OER
Algebra II Test
In this algebra test, learners must determine 3 definitions, match 4 equations to the answer, 4 short answer, and graph 4 points on a coordinate plane. There are 20 questions total.
Curated OER
Graphing Inequalities in Two Variables
This study guide is a great resource to help you present the steps to graphing linear inequalities. Show your class two different ways to graph an inequality and work on a real-world example together. The document could also be easily...
Education Development Center
Points, Slopes, and Lines
Before graphing and finding distances, learners investigate the coordinate plane and look at patterns related to plotted points. Points are plotted and the goal is to look at the horizontal and vertical distances between coordinates and...
Mathematics Assessment Project
Classifying Equations of Parallel and Perpendicular Lines
Parallel parking might be difficult, but finding parallel lines is fairly simple. In this instructional activity, learners first complete an assessment task involving parallel and perpendicular lines in the coordinate plane. Individuals...
West Contra Costa Unified School District
Solving Systems of Inequalities
Don't throw away those transparency sheets just yet! Young scholars first review inequalities on a number line, then learn about graphing inequalities in the coordinate plane. Finally, they use overhead transparencies to create systems...
101 Questions
Nana's Lemonade
Consistency is the key. One lemon wedge per glass of water makes a nice glass of lemonade. Young scholars must identify the number of lemon wedges they need to make the same lemonade in a big gulp cup. They develop their own solution...
Curated OER
Exploring Area/Perimeter Through Coordinate Geometry
Students explore area and perimeter through coordinate geometry using student literature, hands-on manipulatives, and the Internet.
Curated OER
Graphing Inequalities in Two Variables
In this graphing inequalities instructional activity, 9th graders solve and graph 6 different problems that include two variables. First, they define the given vocabulary terms found at the top of the sheet. Then, students graph each...
Curated OER
Graphing Linear Equations - With Table
Learners describe relations and graph linear functions. After studying a geometric shape and a verbal statement, students contrast the differences between the verbal statement and the picture. They determine functions and graph...
Curated OER
Straight Graph Lines: Coordinates
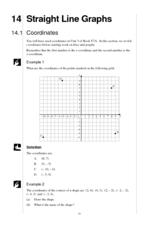
Students access prior knowledge of coordinates. In this coordinates lesson, students graph coordinate points to create a symmetrical figure and of a straight line. Students complete several practice examples.
Curated OER
Locate Points on a Grid: Practice
In this ordered pairs worksheet, students use the graph and write the letter of the point for each ordered pair. Students then write the ordered pair for the given points. Students then answer the six grid location questions.
Curated OER
Math Mediator Lesson 10: Slope
Students explore the concept of slope. In this Algebra I lesson, students investigate the definition of slope as rise over run or change in y compared to change in x. The lesson includes a real-world problem in which the height of high...
Curated OER
What's Your Shoe Size? Linear Regression with MS Excel
Learners collect and analyze data. In this statistics lesson, pupils create a liner model of their data and analyze it using central tendencies. They find the linear regression using a spreadsheet.
Curated OER
Four Quadrant Grid
Use this math worksheet to have your charges engage in positive and negative numbers for math coordinate graphing purposes. There are no questions on the page which is labeled for grade 5.
Curated OER
Year 5 - Term 2
This incredibly thorough and challenging presentation should engage all of your young math whizzes. Each of the 94 slides has tips, problems, puzzles, and brain teasers that will test the math abilities of even your top learners. An...


