Curated OER
Graphing Inequalities
Students graph linear equations and then find the person in class whose linear equation graph is perpendicular to theirs. In this graphing inequalities lesson plan, students graph their perpendicular slopes and then once their find their...
Curated OER
Graphing Linear Equations
Students graph linear equations. In this algebra lesson plan, students solve linear equations and graph it on a coordinate plane. They evaluate integers using linear equations.
Curated OER
Solving Systems of Equations by Graphing
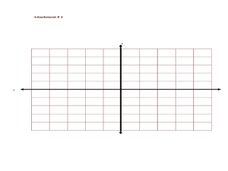
In this systems of linear equations worksheet, students graph two equations on each coordinate grid. All systems are linear. One of the systems is parallel. The others have one point of intersection.
Curated OER
Graphing Linear Equations
In this math worksheet, students practice graphing the linear equations on the Cartesian plane. They also create a function table for each.
Curated OER
Matrix Madness!!
Perform operations to add, subtract, multiply and divide matrices. Then solve problems with vectors using matrices. A three day activity: Matrix Madness, Mystical Matrices, and Decode the Encode. The last activity has prizes that the...
West Contra Costa Unified School District
Sneaking Up on Slope
Pupils determine the pattern in collinear points in order to determine the next point in a sequence. Using the definition of slope, they practice using the slope formula, and finish the activity with three different ways to determine the...
Charleston School District
Review Unit 4: Linear Functions
It's time to show what they know! An assessment review concludes a five-part series about linear functions. It covers all concepts featured throughout the unit, including linear equations, graphs, tables, and problem solving.
Curated OER
Line of Best Fit
In this line of best fit worksheet, students solve and complete 8 different problems that include plotting and creating their own lines of best fit on a graph. First, they study the samples at the top and plot the ordered pairs given on...
Shodor Education Foundation
InteGreat
Hands-on investigation of Riemann sums becomes possible without intensive arithmetic gymnastics with this interactive lesson plan. Learners manipulate online graphing tools to develop and test theories about right, left, and midpoint...
CCSS Math Activities
Smarter Balanced Sample Items: 6th Grade Math – Claim 4
Develop a model for prep. The resource provides examples of how items reflect modeling and data analysis for Smarter Balanced assessments. Items use on-grade or below-grade content to focus on the modeling aspect. The questions revolve...
Mathematics Assessment Project
Sugar Prices
Sugar rush! In this assessment task, learners interpret points on a scatter plot representing price versus weight for bags of sugar. They then determine the bag that represents the best value.
Curated OER
What's Up With My Class
Learners collect data about their class and they use Excel spreadsheet to display their tables and graphs about the class. They answer survey questions and collect their data. Students create a graph of their choice to display the...
Curated OER
Battle Shapes
Fifth graders play Battleshapes which is a variation of Battleship with geometry. In this geometry lesson, 5th graders get a graph paper with four quadrants. They call out coordinate points and attempt to sink their opponents shapes.
Curated OER
LAND USE ISSUES
Learners relate math with real life situations. They identify and plot points on a grid map. They identify and locate the Drop Box Sites.
Curated OER
Solving Systems by Graphing
Students solve systems of equation through graphing. In this algebra instructional activity, students solve linear equations and analyze the result to figure out if there is one solution, no solution or infinitely many solutions. They...
Curated OER
Solving a Pair of Linear Equations by Graphing
Teach your math lovers how to solve linear equations by graphing. Students identify pairs of coordinates and use it to graph a line and use the TI to graph and observe the line.
Curated OER
Graphs with Algebra and Geometry
In this math worksheet, students analyze graphs, the coordinate plane and angles. They identify polygons based on their number of sides and interior angles. There are 4 questions with an answer key.
Curated OER
Graphing Points: Post Test
In this graphing points activity, students answer multiple choice questions about the points on a given graph. Students answer 10 questions total.
Curated OER
Problem Solving: Graphing Functions
In this graphing functions activity, students solve 6 word problems, finding ordered pairs, missing coordinates and numbers, slopes of lines and functions.
Curated OER
Plot the Coordinates
In this geometry skills worksheet, students plot the listed coordinates on the provided graphs to create letters of the alphabet.
Curated OER
Graphing Linear Equations with Calculator
Students graph lines using the calculator. In this algebra lesson, students graph lines of equations in the form y=mx+b. They input equations into the TI Calculator and graph using the slope and intercept. They analyze the graph for...
Curated OER
More Graphing With Intercepts
In this graphing worksheet, learners graph linear equations. They identify the x or y-intercept. Coordinate planes are available below each equation. Nine problems are provided on this two-page worksheet.
Curated OER
Coordinate Graphing
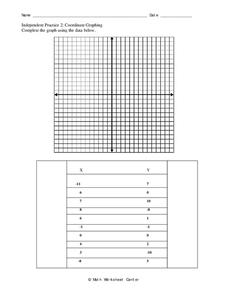
In this coordinate graph activity, 10th graders graph and complete 10 pairs of numbers on the illustrated gird. They graph each x point and label it on the graph. Then, students graph each y point listed on the graph and label those points.
Curated OER
Graphing Review
Students review the principles of graphing linear functions. They discuss plotting points on a coordinate plane, solving using a table, and then graphing. Students solve problems and determine the slope of the line, y-intercept and if...


