Curated OER
Easy Worksheet: Area and Perimeter of Rectangles and Squares
For this area and perimeter of rectangles and squares worksheet, students solve 6 graphing and short answer problems. Students plot four coordinates of a rectangle or square on the coordinate plane. Students find the area or perimeter of...
Curated OER
Writing Linear Equations
In this linear equations worksheet, students observe a graphed line on a coordinate plane. From their observations, they write the slope-intercept form of the equation of the depicted line. This four page worksheet contains eight...
Curated OER
Areas and Perimeters
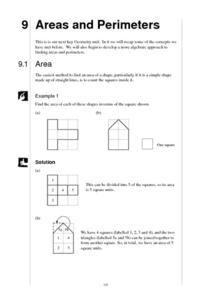
In this geometry worksheet, 10th graders are given polygons on a coordinate plane. They calculate the area and perimeter of each shape, by counting the length of each square on the graph.
EngageNY
Arithmetic and Geometric Sequences
Arithmetic and geometric sequences are linear and geometric patterns. Help pupils understand the relationship and see the connection with an activity that asks them to write the rules and classify the patterns correctly. A sorting...
Curated OER
Growing Up With A Mission
Student measure heights and graph them using growth charts for which they find the mean, mode, and median of the data set. They graph points on a Cartesian coordinate system.
Curated OER
Geometric Transformations
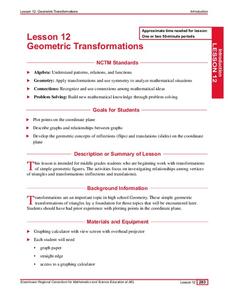
Students solve problems involving transformations of geometric figures. They review graphing points in the coordinate plain, plot points and connect to create a triangle. Then, they reflect triangles over the x and y axis and use...
Curated OER
Graphs and Functions
Students are introduced to plotting functions on the Cartesian coordinate plane seen several categories of functions, including lines and parabolas
Curated OER
Geometric Coordinates
In this geometric coordinates activity, students solve and complete 3 different types of problems. First, they use the equations provided to complete the table on the right. Then, students plot the x- and y- coordinates on the graph to...
Curated OER
Straight Line Graphs
Young scholars discover certain equations produce straight lines. In this graphing lesson, students draw axis and problem solve to find coordinates to graph.
Curated OER
Usage and Interpretation of Graphs
Young scholars review graphing and use processing skills to solve problems.
Curated OER
Spaghetti Bridges: Student Worksheet
In this math worksheet, students will create a "bridge" out of spaghetti and test it's strength with pennies. Students will record their results on a table and then graph the results.
Curated OER
Variables, Formulas, Functions, Graphs and Linear Approximations
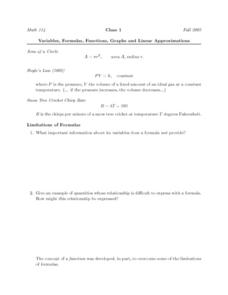
In this limitations of formulas activity, students answer four essay questions about functions. Two questions refer to the limitations of formulas. They graph one function and explain how it specifies the rule of the function.
Curated OER
Carbon Monoxide and Population Density
Tenth graders investigate the carbon monoxide level at a fixed latitude to determine if there is a relationship to population density. They download data sets and generate a graph, and find locations using the Earth's coordinate system....
Curated OER
Rocketsmania And Slope
Students use a professional basketball team's data and graph it on a coordinate plane. They draw a line of regression and finding its equation. They access a website containing statistics for the Houston Rockets basketball team to solve...
Curated OER
Graphing Integers
Fifth graders complete an integer graphing activity. In this integer graphing lesson, 5th graders use coordinate grids to help them complete linear functions and integer graphing.
Curated OER
Graphing Inequalities and Shading
Students graph and shade inequalities. In this algebra lesson, students graph inequalities using the slope-intercept form. They shade the side of the line that is the solution and identify the domain and range.
Curated OER
How Much Will I Spend On Gas?
Students construct a linear graph. In this graphing lesson, students determine a monthly budget for gasoline. Students construct a t-chart and coordinate graph to display data. Resources are provided.
Curated OER
Chapter 3 Review
In this review worksheet, students read circle graphs and line graphs. They identify quadrants in a coordinate plane and match graphs to their appropriate linear equation. Students find the slope of a line and identify the y-intercept....
Curated OER
Translating Graphs of Trig Functions
Students use degrees and compute the amplitude and period of twelve functions. They graph each function on an included coordinate grid.
Curated OER
Graphing Integers
Fifth graders explore the math concept of graphing integers. In this graphing integers activity, 5th graders examine visual examples. Students also practice solving problems that their instructors model.
Mathematics Vision Project
Module 6: Congruence, Construction, and Proof
Trace the links between a variety of math concepts in this far-reaching unit. Ideas that seem very different on the outset (like the distance formula and rigid transformations) come together in very natural and logical ways. This unit...
EngageNY
Lines That Pass Through Regions
Good things happen when algebra and geometry get together! Continue the exploration of coordinate geometry in the third lesson plan in the series. Pupils explore linear equations and describe the points of intersection with a given...
Noyce Foundation
Percent Cards
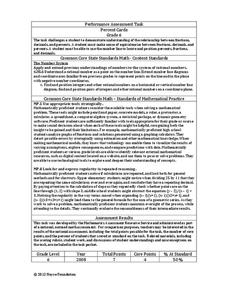
Explore different representations of numbers. Scholars convert between fractions, decimals, and percents, and then use these conversions to plot the values on a horizontal number line.
Achieve
Rabbit Food
Keep your pets slim, trim, and healthy using mathematics! Pupils use a linear programming model to optimize the amount and type of food to provide to a pet rabbit. They model constraints by graphing inequalities and use them to analyze a...


