Curated OER
Systems of Linear Inequalities
For this systems of linear inequalities worksheet, 9th graders solve 10 different problems that include various linear inequalities. First, they solve each equation for y. Then, students graph each individual inequality and locate where...
Curated OER
Paying Attention to Scale
Students create bar graphs. In this graphing lesson, students watch video clips about bar graphs and complete worksheets. The focus of this lesson is on creating the correct scale for the bar graph and correctly labeling the axes.
Curated OER
Rotations (2)
In this graphing worksheet, 5th graders focus on rotations. Students use rotations of 90 degrees and 180 degrees to create 6 geometric figures that are represented.
Curated OER
The Sum of Our Integer Intelligences
Young mathematicians explore integers. They review adding integers through engaging in mathematical labs. Each lab station is designed to reflect one of the multiple intelligences. Resources for all activities are provided.
Illustrative Mathematics
Introduction to Linear Functions
Introduce your algebra learners to linear and quadratic functions. Learners compare the differences and relate them back to the equations and graphs. Lead your class to discussions on the properties of a function or a constant slope...
Ed Migliore
Linear Equations in Two Variables
This traditional textbook style unit includes vocabulary, a direct explanation section, examples, practice problems that directly line up with the explanations and examples, and a unit summary review and practice problems. Learners get...
EngageNY
Matrix Notation Encompasses New Transformations!
Class members make a real connection to matrices in the 25th part of a series of 32 by looking at the identity matrix and making the connection to the multiplicative identity in the real numbers. Pupils explore different matrices and...
Concord Consortium
Shooting Arrows through a Hoop
The slope makes a difference. Given an equation of a circle and point, scholars determine the relationship of the slope of a line through the point and the number of intersections with the circle. After graphing the relationship, pupils...
Curated OER
Data Collection and Presentation
Middle and high schoolers collect and analyze data from four different activities. The activities include information about classmates, tallying colors of cars in a parking lot, stem and leaf plots, and making a histogram from winning...
Ginger Labs
Notability
You'll want to take note of this app! Create custom notes that you can use to present and record information. Use the formatting options to make your notes look great, and the sharing options to keep your class up to date!
Kenan Fellows
Math Made Simple as 1-2-3: Simplified Educational Approach to Algebra
Writing an equation of a line is as easy as m and b. A lesson presentation gives individuals different strategies for writing equations of lines. Some items provide a slope and a point while others provide two points. Whatever the given,...
EngageNY
End-of-Module Assessment Task - Algebra 2 (Module 1)
A series of assessment tasks require learners to process information and communicate solutions. Topics include graphing parabolas, solving linear-quadratic systems, factoring polynomials, and solving polynomial equations.
Curated OER
Line 'Em Up!
Students find coordinate points on a grid and create a line graph with those points. This lesson should ideally be used during a unit on various types of graphs. They make and use coordinate systems to specify locations and to describe...
Curated OER
Quadrilateral Explorations
Ninth graders identify quadrilaterals and label the vertices of quadrilaterals. they justify their identification of the quadrilaterals. Students work in groups to identify and create quadrilaterals
Curated OER
Seasons
Students investigate the reason for seasons on Earth during three activities. They construct a model of the Earth and Sun to identify patterns in the changes of the angle of light on the Earth's surface. Then they conduct a heat...
Curated OER
Reflection: Student Worksheet
In this math worksheet, students will work independently to trace a stencil on an x-axis. Then students will follow a procedure to trace the image on the horizontal line of reflection. Students will observe that reflections and rotations...
Curated OER
Exponential Functions
In this exponential functions activity, 9th graders solve and complete 23 various types of problems. First, they simplify each expression. Then, students evaluate the function at different values of x and plot the ordered pairs. in...
Curated OER
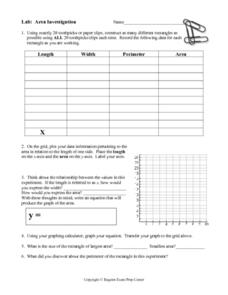
Area Investigation
In this area investigation learning exercise, 8th graders solve and complete 6 different problems that include complete a chart with given data and a graph. First, they construct as many different rectangles as possible using toothpicks....
Curated OER
Using the Balance
Students determine the mass of various objects. In this integrated math and science lesson, students use an arm balance to compare a known object to a combination of washers with a fixed weight. Students record data, construct a bar...
Curated OER
Finding Domain and Range
In this domain and range worksheet, students observe a graph and identify the domain and range of given functions. Afterwards, they solve functions to identify the range. Fifteen problems are provided on this one-page worksheet.
Curated OER
Magnetic Storms
In this magnetic storms learning exercise, students use a graph of data collected over time showing the magnitude of a magnetic storm. Students use the data to solve 6 problems about the graph and they determine the strength of the storm...
Curated OER
Lines, Lines, Everywhere
Students explore linear equation suing real life scenarios. In this algebra lesson, students find the slope and intercept of a line. They create table of values to plot their graph and draw conclusions.
Curated OER
The Way to Better Grades!
Pupils collect and analyze data. In this statistics lesson, learners create a scatter plot from their collected data. They use, tables and graphs to analyze the data and mae decisions.
Virginia Department of Education
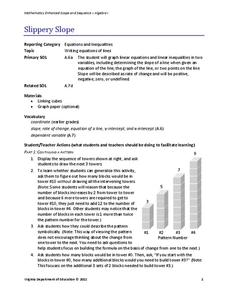
Slippery Slope
Explore slope using geometric patterns. Young mathematicians investigate towers built from cubes to develop a linear pattern. They move the data to a coordinate plane to connect the pattern to slopes.


