Curated OER
Graphing and Interpreting Linear Equations in Two Variables
Graph linear equations using a table of values. Learners solve equations in two variables using standard form of an equation. They identify the relationship between x and y values.
Curated OER
Bouncing Ball
High schoolers collect height versus time data of a bouncing ball using the CBR 2™ data collection device. Using a quadratic equation they graph scatter plots, graph and interpret a quadratic function, apply the vertex form of a...
Curated OER
Another Way of Factoring
Focusing on this algebra lesson, learners relate quadratic equations in factored form to their solutions and their graph from a number of different aspects. In some problems, one starts with the original equation and finds the...
Curated OER
Ashes to Ashes: Using Evaporation Rate to Identify an Unknown Liquid
Learners explore the concept of evaporation rates in this evaporation rates lesson. They will try to identify the chemical that began a fire, perform an experiment where they use the evaporation rates to determine the unknown liquid, and...
Curated OER
Reflecting a Triangle in the Coordinate Plane
Learners explore geometric concepts using technology. They manipulate the TI to find important math topics. This activity requires a TI-84 or higher.
Curated OER
Match The Graph Circles
High Schoolers engage in a study of circles and graphs that are related with the focus upon finding the center and radius. The lesson includes the suggestion of giving homework using circle problems before this one to create background...
Texas Instruments
Let's Play Ball with Families of Graphs
Learners explore quadratic equations in this Algebra II lesson. They investigate families of quadratic functions by graphing the parent function and family members on the same graph. Additionally, they write the equation of the parabola...
Curated OER
Introduction to Limits
High schoolers practice using graphing calculators and spreadsheets as they explore numeric limits using sequences and functions. They complete a sequencing worksheet, and determine which sequence corresponds to story a story called...
Curated OER
Coordinate Graphs, Translations and Reflections
Young scholars perform translations and reflections. In this algebra lesson, students use the TI calculator to graph functions. They move the functions around on the coordinate plane using translation and reflection.
Curated OER
How Big Is The Playground?
Students calculate the standard and metric measurements of a playground. In this measurement instructional activity, students use GPS coordinates and graphing calculators to determine the dimensions of an area outside of the school in...
EngageNY
Interpreting Correlation
Is 0.56 stronger than -0.78? Interpret the correlation coefficient as the strength and direction of a linear relationship between two variables. An algebra lesson introduces the correlation coefficient by estimating and then...
Curated OER
The Quest for Roots of Higher Order Equations
Young mathematicians explore the concept of solutions to higher order equations as they find roots of polynomials of degree three or higher. They also use the zero function on the Ti-83 to locate zeros of polynomials on a graph.
Curated OER
Midpoint of a Segment
Learners revisit midpoint and segments by graphing on the TI or computer. This activity can be done with pencil and paper, but is more interactive if it is done on a TI-navigator.
Curated OER
Ratios in Right Triangles
Learners calculate the sides of right triangles in this trigonometric ratios lesson. They use Cabri Jr. software and TI-83 or TI-84 calculators to find the side lengths and their ratios to each other for various triangles. The provided...
Curated OER
Approaching Limits
With the assistance of their Ti-84/Ti-83 Plus calculators, students develop a foundation for the limiting process as well as estimate limits from graphs and tables of values. They view how a function behaves as the input approaches a...
Curated OER
Proof of the Pythagorean Theorem Using Transformations
Middle and high schoolers construct a triangle using Cabri Jr. They construct squares on each of the legs and hypotenuse of the triangle. Pupils show that the area of the squares on the leg equal the area of the square on the hypotenuse.
Curated OER
Move My Way: A CBR Analysis of Rates of Change
Learners match a given velocity graph and sketch the corresponding position graph using a graphing calculator. After collecting data from their everyday life, high schoolers use specific functions on their calculators to create graphs...
Curated OER
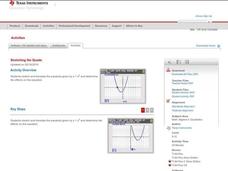
Stretching the Quads
Explore parabolas in this algebra lesson with the graphing calculator. The class investigates what effects the changing of the parameters of the vertex form of a quadrati have to its graph. They find the zeros of a quadratic graphically...
Curated OER
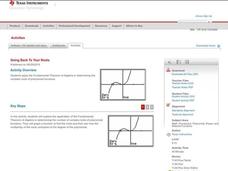
Going Back to Your Roots
Who doesn't need to know the Fundamental Theorem of Algebra? Use the theorem to find the roots of a polynomial on a TI calculator. The class explores polynomials with one solution, no real solutions, and two solutions. This less lesson...
Curated OER
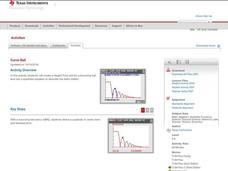
Curve Ball
Learners explore the concept of parabolas by collecting quadratic data on a bouncing ball as it is falling using a motion detector. They plot the data and determine the equation of the quadratic in vertex form, then determine the values...
Curated OER
Slopes and Lines
Students identify the slopes of a line. In this algebra lesson, students calculate the slope and intercept of a line. They graph their lines using a TI calculator.
Curated OER
Visualizing Vectors
Investigate vectors in standard positions and use the CellSheet application on the TI calculator to find the sum of two vectors. Convert from polar to rectangular coordinates and vice versa, and show graphs of the vectors.
Curated OER
Betweenness and the Sum of Parts
High schoolers differentiate lines and angles using betweenness in this geometry instructional activity. They differentiate angles and lines using Cabri Jr. and analyze the data and make conjecture.
Curated OER
Big Wheels Keep on Turning
Eleventh graders work in groups and investigate how force determines the speed and distance then they view the video, "Math Vantage #7: What's Your Angle?." They are given a real life problem to solve using speed, ramps, angle, incline...


