Curated OER
A New Phase In Town
Middle schoolers explore heat energy and how it is used to change the phase of matter, and discover that temperature does not increase or decrease until the phase change is complete. This extremely well-written plan is packed with great...
Curated OER
"You're Hired!'
Students investigate linear programming using the TI. For this algebra lesson, students collaborate and graph linear inequalities on a TI. They analyze their data and present it to the class.
Curated OER
Statistics
High schoolers log their computer usage hours. They determine the mean, median, mode and standard deviation of the collected data. They make a frequency histogram of the grouped data, both on graph paper, and on the TI 83+ graphing...
Curated OER
Investigating Motion
Students determine velocity using the slope of a time distance graph. They investigate a motion cart using a CBR unit and a TI 83 calculator setup. Using the graph generated, they calculate velocity.
Curated OER
Drawing a Triangle with Cabri Junior
Learners draw triangles on their graphing calculators using the Cabri Junior application. In this graphing calculator lesson, students follow step by step directions to create triangles on their calculator. They identify the type of...
Curated OER
Exploring Circles
Students explore circles using a graphing calculator. In this circles lesson, students write the equation of a circle with a given center and radius length. Students find the most appropriate model for each combination of data they...
Curated OER
Coming to Know F and C
Pupils collect temperatures using a probe and examine data. In this temperature lesson students complete an activity using a graphing calculator.
Curated OER
Regressive Music
Student use the Ti calculator to graph sinusoidal graphs. In this calculus lesson, students use the CBL to collect and analyze data of sinusoidal graphs. They manipulate their collected data and make predictions.
Curated OER
Real Estate Lesson: Monthly Payments
Students examine real-world data relating to real estate. They conduct Internet research, record data regarding real estate in major cities, graph the data, calculate mortgage payments using a mortgage calculator, and analyze the data.
Curated OER
Off to College
High schoolers investigate linear, quadratic and exponential equations using the TI calculator. They identify relation and functions using ordered pairs, graph the data, analyze the data, and relate it to real-world situations.
Curated OER
Standard Form of Equations
Learners complete the square and identify different parts of a quadratic equation. In this algebra lesson, pupils graph conics using the TI calculator. They rewrite equations by completing the square.
Curated OER
Wrapping It All Up
Through learning how to examine linear, quadratic, and exponential functions, young scholars explore the effects of changes in parameters on the graphs of linear, quadratic, and exponential functions. The lesson plan is designed to...
Curated OER
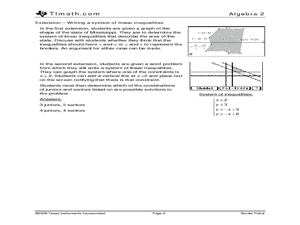
Border Patrol
Young scholars investigate systems of linear inequalities as they apply to an area of land. They practice graphing systems and determine if a point lies in the solution.
Curated OER
Exploring the Exponential Function
Learners collect and analyze data regarding exponential functions of the form y = abx. Students explore the affects of changing parameters on the graph of the function.
Curated OER
Games for Probability: In-Class and Powerball Simulation
Your soon-to-be statisticians play a game to understand the difference between independent and dependent experiments and probability. They draw colored cubes from a bag and then, by either replacing the cube in the bag, or not, for each...
Curated OER
The Swinging Pendulum
Students observe a pendulum and graph their observation. In this algebra instructional activity, students use the TI calcualtor to graph the motion the pendulum makes. They analyze the graph and make predictions.
Curated OER
Round and Round and Round We Go!
Students investigate motion using a CBL. For this algebra lesson, students collect and graph data on a coordinate plane. They define and identify amplitude and period of conic graphs.
Curated OER
Determining the Relationship Between pH and Hydrogen Ions with Microcomputer Based Lab (MBL) and/or Calculator Based Lab (CBL) Equipment
Young scholars find the relationship between the variables based on experimental data. They determine mathematical relationship between pH and the amount of hydrogen Ions in solution.
Texas Instruments
Vandalism 101
Learners explore logic and use Geometer’s Sketchpad and patterns of logic to solve a puzzle.
Curated OER
Connecting Factors and Zeros
In this Algebra II lesson, students explore the connection between the factored form of a quadratics and the zero of a function. Students use a graphing calculator to verify factoring numerically and graphically.
Curated OER
Hit and Run
Pupils explore data collection in this lesson. They investigate distance vs. time and velocity vs. time graphs using information collected with a CBR 2 to simulate the reconstruction of an accident.
Curated OER
Perpendicular Bisector Theorem
High schoolers construct perpendicular bisectors using Cabri Jr. on their graphing calculator. They then construct conditional statements about perpendicular bisectors along with their converse, inverse, and contrapositive.
Curated OER
Exploring the Orthocenter of a Triangle
Young mathematicians explore the concept of triangles as they construct altitudes of triangles to find the orthocenter. Learners construct their triangles using Cabri Jr. on their graphing calculators and find that the altitudes of a...
Curated OER
Slow Down - Speed Up
Pupils explore the concept of distance and time as they use a CBR to mimic distance v. time graphs. Learners walk towards and away from the monitor to create various distance v. time graphs, then discuss what motion creates certain graphs.


