Curated OER
Midsegments of Quadrilaterals
High schoolers explore the concept of quadrilaterals as they find the midsegments of quadrilaterals using Cabri Jr. on a graphing calculator. They find midpoints, slopes, angles, and distances of lines and angles.
Curated OER
Multiplying Monomials
Learners differentiate between linear and quadratic functions. In this algebra instructional activity, students write equations of graphs and graph a function from an equation. They also identify the slope and y-intercept.
Curated OER
Let's Gather Around the Circle
Scholars explore the relationship between circumference and diameter. Groups of learners measure the diameter and circumference of round objects and record their data on a given worksheet. They then input the data into their graphing...
Curated OER
Classifying Triangles by the Length of the Sides Using Cabri Jr.
Learners follow detailed directions to create triangles on their graphing calculator. In this properties of triangles lesson plan, they will create triangles on their calculators using the Cabri Jr. application. They then identify three...
Curated OER
Using Cabri Geometry to Create Fractals
Learners construct the Sierpinski Triangle using Cabri Jr. They use a step-by-step guide to construct the Sierpinski Triangle on their graphing calculator and then discuss the formula for constructing a nth stage Sierpinski Triangle.
Curated OER
Investigating Segments in a Triangle
Pupils investigate segments in a triangle by constructing a triangle using Cabri Jr. They construct segments within the triangle that lie on the midpoints of the triangle's sides. Learners then compare the slope of base of the triangle...
Curated OER
Constructions Triangles
Learners explore the difference between a construction and a drawing. They focus on various ways to construct different types of triangles. The lesson is an application of Cabri Jr. and reinforces the difference between a constructions...
Curated OER
Videobusters
A real-world scenario, Videobusters, a video rental store has just got to get organized. In small groups, the class works on organizing and analyzing data utilizing matrices. They need to use their skills in adding, subtracting and...
Virginia Department of Education
Solving Linear Equations
Practice solving linear equations by graphing. Scholars learn to solve multi-step linear equations in one variable by graphing both sides of the equation separately. They use graphing calculators to find the intersection of the graphs.
Curated OER
In Debt or Not In Debt
Students investigate the use of credit cards. In this algebra lesson, students differentiate the interest rate of credit cards and how to stay debt free. They identify pros and cons of credit cards.
Curated OER
Linear Programming and the Inequalz App
Learners graph system of linear inequalities in this lesson. Your class will use the Inequality Graphing App to enter linear programming functions into the calculator that can be stored for later use. They then determine the maximum for...
Curated OER
Introduction of Single and Multiple Linear Inequalities
Students solve linear inequalities. In this algebra lesson plan, students rewrite inequalities using one and two step equations. They graph their findings and identify the slope and solution of the line.
Curated OER
Properties of Parabolas
Have your learners investigate parabolas. For this Algebra II lesson, high schoolers explore the basic definition of a parabola by using Cabri Jr. to create a parabola given the focus and directrix. Students interpret the equation...
Curated OER
Strike a Pose: Modeling in the Real World (There's Nothing to It!)
Adjust this lesson to fit either beginning or more advanced learners. Build a scatter plot, determine appropriate model (linear, quadratic, exponential), and then extend to evaluate the model with residuals. This problem uses real-world...
Curated OER
The Wave of the Future
Twelfth graders discuss sine curves and enter equations into their graphing calculator then compare different graphs created on their calculators. They identify the period, amplitude and phase shift given the graph or the equation of a...
Curated OER
Mean, Median, and Mode
Eighth graders practice using the LIST key on graphing calculators using the proper syntax. They work with the functions of mean, median, and mode in a teacher led lesson and then with a partner on a second data set. They follow...
Curated OER
Handy Reflections
Learners explore reflections on a coordinate plane in this lesson. They trace their hand on a grid, determine the coordinates of each point, and create a scatter plot of their points. Pupils use this information to investigate aspect...
Curated OER
Connecting Translations, Reflections, and Rotations
Learners differentiate between translation, reflection and rotation. They explore the 3 types of transformation using Cabri Jr. and build on previous knowledge in this instructional activity.
Curated OER
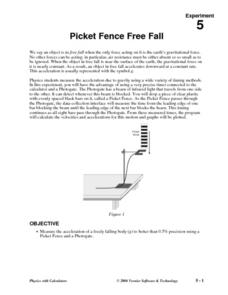
Picket Fence Free Fall
Students measure acceleration using a Picket Fence and a Photogate. In this physics lesson, students drop an object and measure the acceleration of the object free falling. They log their data using the TI.
Curated OER
Bouncing Ball Experiment
Learners collect data for a bouncing ball and select one bounce to analyze. They explore the relationship between velocity, position and acceleration. They seek out connections between the graphs and the physical motion of the ball.
Curated OER
Line of Best Fit
Students identify the line of best fit. In this statistics lesson, students collect and analyze data. They calculate the regression equations and identify the different types of correlation.
Curated OER
La Toteca- A Tropical Paradise
Students collect data on the time of the ferry. In this algebra lesson, students use the data to predict a ferry schedule. They also compute the depth where oxygen would be needed when diving.
Curated OER
High and Low Tides
Students collect real world data from the Web regarding high and low tides at various locations in the United States. They find a function which models this data and make predictions on tide levels based on the information found.
Curated OER
Let's Get Physical
Students collect data using the CBL. In this statistics activity, students predict the type of graph that will be created based on the type of activity the person does. The graph represents heart rate depending the level of activity.


