Curated OER
Feeling the Heat
Pupils record temperatures at different locations around campus. They examine the results and draw conclusions about how materials and colors affect the amount of heat produced. They also analyze Los Angeles' temperature records over a...
Concord Consortium
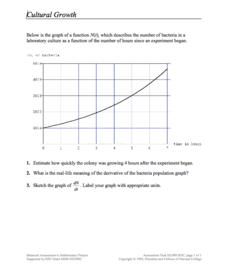
Cultural Growth
Scholars read and interpret a graph relating bacterial growth in a culture over time. They apply knowledge of derivatives, estimation, and graphing to the skill practice questions.
Curated OER
Changing Planet: Sea Levels Rising
Begin by showing a six-minute video, Changing Planet: Rising Sea Level as an anticipatory set. Pupils draw a topographic map of a potato continent. Finally, they will visit NOAA's sea levels online map and NASA's carbon dioxide...
Curated OER
Education for Global Peace
Fifth graders construct data graphs based upon sets of data. In this graphing instructional activity, 5th graders read the text If the World Were a Village and discuss how types of graphs accurately represent a large population. Students...
Curated OER
Education for Global Peace
Students survey the class and graph the results. In this graphing and data collection lesson, students conduct a survey to see where their shirts were produced. Individuals use software to graph the results and create a written...
Curated OER
Predator/Prey Relationship
Students study and analyze data collected on the relationship between the snowshoe hare and lynx in Canada over a 28 year period and create a graph. Students also write a response to a proposal to reduce the lynx population.
Curated OER
The Ghost of Populations Past
Students study population distribution and survivorship curves by collecting data regarding age of death of humans from either tombstones, newspapers, or other community resources. Students analyze data by creating graphs and population...
Curated OER
Lobster Roll!
Students collect data by playing a game that illustrates the delicate ecological balance between fishing, fishing regulations and fish populations. They graph and analyze the data and explain how economic decisions can affect the...
Curated OER
The Coyote Population: Kansas Prairies
Students discover animal lifestyles by researching their ecosystem. In this animal statistics lesson, students research the geography of Kansas and discuss the reasons why wild animals survive in the open Kansas fields. Students complete...
Curated OER
My Favorite Birthday
Learners collect and organize data from classmates, display data on simple chart, and plan class birthday party.
Curated OER
Mapping Possible Solutions
Fourth graders propose possible sites for the heart of Florida state capital by mapping collected data onto a Florida state map and recording data in a Travel Log.
Curated OER
Populations Lab - Exponential Graphing
Ninth graders investigate the application of populations that exists in one's everyday environment, in order to develop an understanding of how mathematics is a key component in the understanding of population dynamics.
Curated OER
Modeling Population Growth
Learners investigate the reasons for taking a census and determine the problems that are involved in the process. They examine the population figure for Montana and Lake county before using the information to complete the included...
Curated OER
Exploration of "Pillbugs"
Fifth graders define vocabulary terms, identify the characteristics of a pillbug, and create a dichotomous key. Then they examine the pillbugs and make observations and record these observations. Finally, 5th graders observe specific...
Curated OER
"Dead-Zones" and Coastal Eutrophication: Case-Study of Chesapeake Bay
Take an in-depth look at nutrient loading, eutrophication, and hypoxia using data on The Chesapeake Bay as an example. This comprehensive presentation includes detailed graphs, photos, and details about the changes in marine organism...
Curated OER
Oh, What A Day
Students listen as the teacher reads A Country Far Away. They predict what they will do and what they think their partner student will be doing. Students create a KWL chart for Japan. They collect information about their activities on an...
Curated OER
Deer: Predation or Starvation
In this predation or starvation worksheet, learners read about the effects of the wildlife service bringing in predators (wolves) to control a deer population. Students calculate the change in the deer population from 1971 to 1980. They...
NOAA
What Killed the Seeds?
Can a coral cure cancer? Take seventh and eighth grade science sleuths to the underwater drugstore for an investigation into emerging pharmaceutical research. The fifth installment in a series of six has classmates research the wealth of...
Curated OER
Population Study and Applications Using PTC Paper
Students study human population traits. In this science lesson plan, students gain an understanding of the terms dominant, recessive, haploid (monoploid), diploid, genotype, phenotype, scientific sampling, and scientific modeling as they...
Curated OER
Using Charts and Graphs to Study East Asia's Modern Economy
Students examine East Asia's modern economy. In groups, classmates use the internet to compare the resources, products, and economy of specified countries. After collecting the data, pupils create charts, tables and graphs. They...
Curated OER
Endangered Species
Ninth graders graph data in order to compare the number of extinct species and a rise in human population. They analyze the data collected. Students are encouraged to infer the relationship.
Curated OER
Bugs, Bugs, Everywhere!
Students collect and compare bugs using magnifying lenses and graph data based on their comparisons. In this bugs lesson plan, students also make an aspirator by using a jar, tubing, and screen.
Curated OER
Natural Selection Simulation
Students simulate the changes in a natural population of birds or other species. They establish baseline data of population fluctuation for a closed population with a stable food supply. They graph the data to complete their mutations.
Curated OER
Population Dynamics of Growth of Drosophila
Students experiment with Drosophila to determine if density of female flies, food sources, temperature and light affect the population dynamics of growth. Students graph their data and compare their results to the number of human...


