Curated OER
The Lesson of the Kaibab
Students plot the Kaibab deer population from 1905 to 1939 and analyze the changes over time. In this populations lesson plan, students investigate the causes of changing populations of the Kaibab deer and they find the carrying capacity...
Curated OER
CSI Rhino
High schoolers study the rhinoceros and how the species has survived for so long. For this rhino lesson students create graphs and research what is being done to protect the rhino.
Curated OER
Water, Water Everywhere?
Students discover the relationship between water availability and population growth. They change variables in a computer model using a worksheet to guide their hypotheses and conclusions. In small groups they choose a country undergoing...
Curated OER
United States Population: Using Quadratic Models
In this United States population worksheet, students solve word problems about the United States population by using the quadratic formula. Students complete 6 problems.
Curated OER
Populations and Ecosystems
Sixth graders examine the factors that influence the stability of ecosystems. They construct a miniature ecosystem in a jar that includes plants, small fish, and snails, record the population changes over a period of four weeks, and...
Curated OER
Canadian Cities
Fifth graders gather population data on twelve cities in Canada. They present the information on a spreadsheet and sort the data on two different types of graphs. They create a generalization for the data that they collected.
Curated OER
Nutria And The Disappearing Marsh
Young analysts examine changes in the nutria population, vegetation density, and marsh area over time in the wetlands of Louisiana. They import data and use the TI-73 Explorer to graph and analyze the effects of nutria on marsh loss.
Curated OER
Predator-Prey Simulation
High schoolers simulate the interactions between a predator population of lynx and a prey population of rabbits. They collect and graph the data, then extend the graph to predict the populations for several more generations.
Illustrative Mathematics
Do You Fit In This Car?
A short activity that focuses on the normal distribution as a model for data distribution. Using given means and standard deviations, your budding statisticians can use statistical tables, calculators, or other statistical software to...
Curated OER
Who Gave It to You?
Students use logic to locate the primary cases, the people who started the spread of the disease through the population. They graph the data of the number of people infected over time (exchanges) and determine an equation that best fits...
Curated OER
Survey Project
Eighth graders create a website using FrontPage. They use inserted forms to collect survey information and use Microsoft Excel and MS Word to create a presentation of the survey and the results.
Curated OER
No New Workers Need Apply
Students explore older people's perspectives on work and retirement by creating charts to reflect statistical trends and formulate interview questions. They write follow-up articles that record and comment on the attitudes of their...
Curated OER
Population Pyramids
Students utilize population pyramids to answer questions, make comparisons, draw conclusions and support predictions about the populations of China, India and the Unites States. They arrange numbers and symbolic information from various...
Curated OER
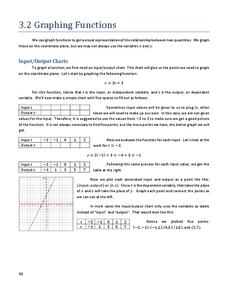
Graphing Functions
In this graphing functions instructional activity, students write functions in logarithmic and exponential forms. They evaluate logarithms and determine the inverse of a function. Students graph functions. This six-page instructional...
Curated OER
Lesson 3: Understanding Population Growth
Students explain population growth in Maryland and its relationship with age structure, household growth and consumption of land.
Curated OER
Successful Resource-based Learning Strategies for the Geography of Canada Course
Students conduct a statistical research project on population changes. They evaluate demographic issues, such as the size and location of native people. immigrant groups, and the age and gender of the population.
Noyce Foundation
Ducklings
The class gets their mean and median all in a row with an assessment task that uses a population of ducklings to work with data displays and measures of central tendency. Pupils create a frequency chart and calculate the mean and median....
Curated OER
Patterns of Evolution and Selection
Can your young biologists interpret population graphs, match macroevolution patterns and descriptions, and answer multiple choice questions about evolution? Find out with a comprehensive three-page quiz covering some specific examples of...
Curated OER
Capture/Recapture
Students use proportions to estimate the size of populations. They describe the data with using a graph or table of the estimate. Students use descriptive statistics to calculate mean, median, and mode. They also compare and contrast an...
Curated OER
Aboriginal Peoples
Middle schoolers examine data from the 2001 Census on the Aboriginal population. They cover the topics of distribution of the Aboriginal population across the country, the three Aboriginal groups, age, and language. Students build...
Curated OER
Saskatchewan's Population Distribution
Pupils explore landforms, vegetation, climate and population distribution in Saskatchewan. After discussing an atlas of Saskatchewan, students create their own relief map and climagraphs of Saskathewan. Using specified websistes,...
Curated OER
Outbreak!
Eleventh graders explore the spread of a disease through a population. In this Algebra II lesson, 11th graders analyze graphical data representing they spread of a disease. Students produce a graph of the virus data, analyze the data,...
Curated OER
Ocean Botttom Profile
Students interpret a graph of ocean depths and topographic features. This task assesses students' abilities to interpret figures, organize and represent data, apply knowledge of scale to a profile, and apply theoretical knowledge.
Curated OER
What are the Chemical and Microbiological Effects of Run-off from a Catfish Pond on the Surrounding Soil and Water?
Students study data from a USDA catfish pond. They look for microbial populations and chemical concentrations in the runoff to determine the effectiveness of filter strips. They use their knowledge of biogeochemical cycles to explain the...


