Curated OER
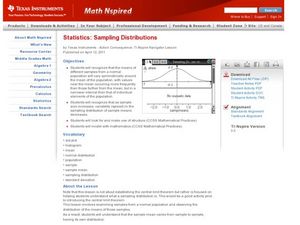
Sampling Distributions
Students analyze sampling from different population. In this statistics lesson, students define the meaning of sample sizes and what causes an increase or decrease. They graph their data on the Ti calculator and draw conclusion from the...
Curated OER
Pika Chew
Students work in collaborative teams with specific roles, use the Internet to research the behavior and ecology of pikas, make predictions about survival rates of pikas in different habitats and organize their data in graphs.
Curated OER
Invasion of the (Cactus) Booty Snatchers
Students, in groups of four,identify and analyze relationships among birds within a population, a community and an urban ecosystem. They fill out, while they're completing their experiments, a Populations of Birds Student Data Sheet.
Curated OER
Pop Clock
Pupils review the Census Bureau's Homepage, gather information regarding population trends in order to make predictions on future populations.
Curated OER
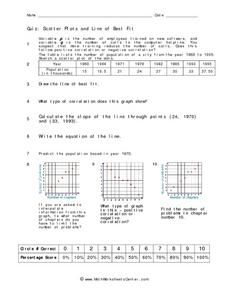
Quiz: Scatter Plots and Line of Best Fit
In this scatter plots and line of best fit worksheet, students create scatter plots from given sets of data. They answer questions concerning the scatter plot. Students write the equation of a line, identify the type of correlation...
Curated OER
Scatter Plots
In this scatter plots worksheet, students solve and complete 4 different problems. First, they use the table shown to model the relation with a scatter plot and trend line and to predict the value of a variable when given the other...
Curated OER
Puerto Rico Pyramid Scheme
Students are introduced to the purpose of a population pyramid. In groups, they compare and contrast various population pyramids and identify trends about the civilization being examined. With a focus on Puerto Rico, they work together...
Curated OER
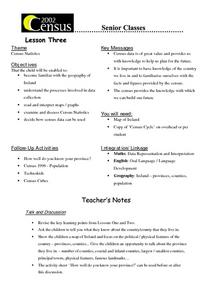
Census Statistics
Twelfth graders become familiar with the geography of Ireland. They explore the processes involved in data collection. Students examine and discuss Census Statistics and read and interpret maps/graphs. They decide how the census data can...
Curated OER
Graphing and Analysis of Water Quality Reports
Students practice making graphs and interpreting them. They compare and contrast different sets of data. They use Microsoft Excel to create different types of graphs.
Curated OER
Hurricanes in History:
Students interpret data displayed in a graph, make inferences based on graphical data. They work in pairs or groups to interpret graphs containing historical data of hurricanes, and then answer questions that assess their understanding...
Curated OER
Ohio Census 1990 & 2000
Students use Ohio census data to solve problems, make comparisons, draw conclusions, and support predictions related to Ohio's population. They interpret and work with pictures, numbers and symbolic information.
Curated OER
Eerie Indiana!
Eleventh graders research the population for ten cities in their state, in this example, Indiana, using census information. They design a spreadsheet using the data and create a bar graph with the data. They complete follow up questions.
Curated OER
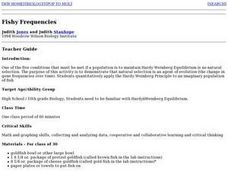
Fishy Frequencies
Tenth graders demonstrate that natural selection is an agent of evolution. They quantitatively apply the Hardy-Weinberg Principle to an imaginary population of fish. They utilize math and graphing skills, collecting and analyzing data,...
Curated OER
Endocrine Disruptors in Our Drinking Water: Should We Be Concerned?
Young scholars investigate the different hormone contaminants in the water supply. In this math lesson, students analyze data tables and graphs. They demonstrate exponential growth and decay using frog populations.
Curated OER
Time Changes Everything
Students analyze census data from 1915, 1967 and 2006. They read an article about how the world's population is growing at an alarming rate. They use primary source documents to create a timeline on the information they gathered. They...
Curated OER
Bacteria and Illness
Students research information on bacterium and their relationship to food borne diseases. In this science lesson plan, students complete internet research to construct and analyze the growth cure of common bacterium and food-borne...
Curated OER
World Population Study
Learners explore an exponential relationship and how it relates to human population growth and the current global population crisis. They graph both exponential and linear information.
Curated OER
WORLD POPULATION STUDY
Students explore an exponential relationship and how it relates to human population growth and the current global population crisis.
Curated OER
Influence of Union and Confederate Resources in 1860 on the Civil War
Eighth graders compare/contrast population, railroad mileage, manufacturing plants, and industrial workers between the Union and Confederate States in 1860; students analyze effects of the resources of the Union and Confederate Forces on...
Curated OER
Money Circulation: A Story of Trade and Commerce
Middle schoolers are introduced to the meaning, symbolism, and value of the quarter. They determine the percentage of total monetary value held in quarters and graph the results. Students infer about the U.S. Mint's distrubution of...
Curated OER
Balancing Act
Students investigate the dramatic increase in world population and the unequal distribution of resources. They examine the six world regions and how they are affected by the increase in population.
Curated OER
State Database Lesson
Fifth graders create a database about the geography of the United States. The access to a computer is essential for this lesson. The outcome is that technology is used as a tool to measure student understanding of geographical locations....
Curated OER
Land Use Unit
Students identify factors in human society and the natural environment aree interdependent. They analyze interdependencies demonstrated in various situations and occurances.
Curated OER
Hare and Lynx Population
Fourth graders study changes in animal population. In this graphing lesson, 4th graders create graphs from information read to them about hares and lynx populations. They will describe patterns of change in the graphs and discuss why...


