US Census Bureau
Us Census Bureau: Population Pyramid Graph for Canada
Graphs showing the population pyramids of Canada from the year 2018. Shows a comparison of males versus females.
PBS
Pbs: The Lowdown: Exploring Changing Obesity Rates Through Ratios and Graphs
In these KQED Lowdown infographics, explore how adult obesity rates in the United States, as measured by body mass index (BMI), have dramatically changed in the past half-century. A circular graph and a pictograph depict data by decade,...
PBS
Wnet: Thirteen: Ed Online: Growing, Growing, Graphing!
Students explore the growth population of China and use graphs and equations to display data.
BSCS Science Learning
Bscs: Frog Eat Frog World
Using maps and graphs of large data sets collected in FrogWatch, students will determine the range, preferred land cover, and proximity to water of the American bullfrog to figure out the bullfrog's requirements for food, water, and...
Texas Instruments
Texas Instruments: Math Today World Population in 2050
The data in the USA TODAY Snapshot "World Population in 2050" is in a relative frequency form. students can use the percents to calculate the population for each of the continents shown and then display this data as a bar graph.
Illustrative Mathematics
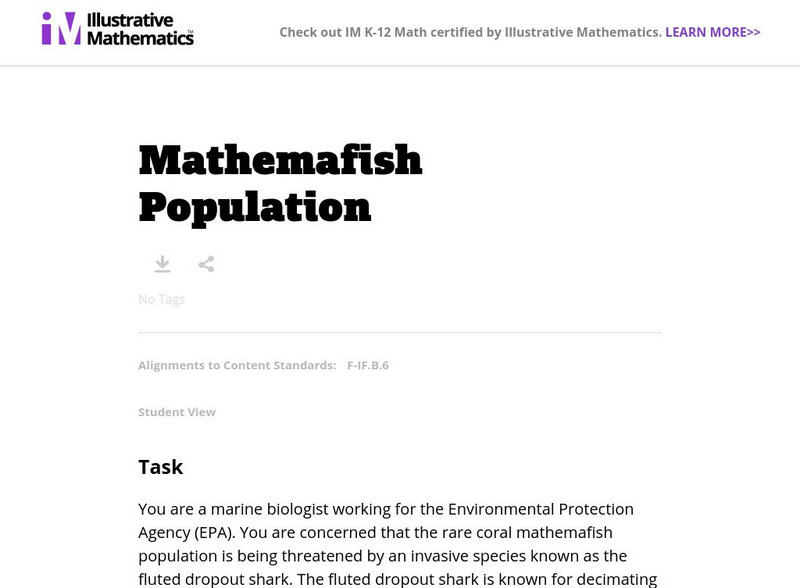
Illustrative Mathematics: F If.6 Mathemafish Population
For this task, learners are presented with a table and a graph and are asked to summarize the data and report the findings of a project by the Environmental Protection Agency to contain the effects of an invasive species on a fish...
Texas Instruments
Texas Instruments: Nevada's Population
In this activity, students examine patterns and use these patterns to try to predict different aspects of an event. They study the statistical patterns for the population of the state of Nevada over a period of hundred years, and predict...
Science Education Resource Center at Carleton College
Serc: Determining Bird Populations Through Counting
Students participate in a bird count to determine the number of birds sighted in four different sites. Students draw inferences from recorded data on a bar graph in regard to the number of species in the area and relative population size.
BSCS Science Learning
Bscs: Global Night Sky Comparison
This inquiry invites students to investigate human impacts on the environment. Specifically, students will examine the relationship between human population, light pollution, and how brightly celestial objects like stars appear in the...
Climate Literacy
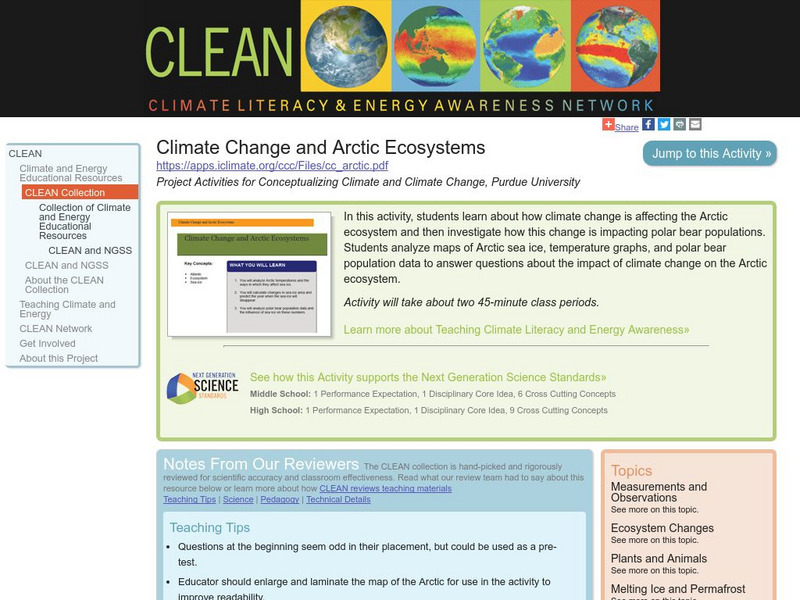
Clean: Climate Change and Arctic Ecosystems
Students learn about how climate change is affecting the Arctic ecosystem, and then investigate how this change is impacting polar bear populations. Students analyze maps of Arctic sea ice, temperature graphs, and polar bear population...
US Census Bureau
Uscb: Us Government: Us Census Bureau
Site provides census data for housing, population data, people, and much more.
Science Education Resource Center at Carleton College
Serc: Investigating the Ecology of Goldenrod Galls Through Biological Sampling
In this biology field lab exercise, students conduct a stationary population study of goldenrod galls. They examine a host of factors including goldenrod plant density, goldenrod gall density, gall height, gall mass, larval exit hole...
Other
The Learning Partnership: Journey to El Yunque
In this set of learning modules, students examine the impact of hurricane weather on the El Yunque rainforest in Puerto Rico. They learn about hurricanes, producers, consumers, and the food chain, and how disruptions in organisms'...
Calculator Soup
Calculator Soup: Descriptive Statistics Calculator
This is a statistics calculator; enter a data set and hit calculate. Descriptive statistics summarize certain aspects of a data set or a population using numeric calculations. Examples of descriptive statistics include: mean, average,...
CK-12 Foundation
Ck 12: Algebra Ii: 5.4 Standard Deviation
Explore what the standard deviation is as it relates to the graph of a normal distribution curve.
Science Education Resource Center at Carleton College
Serc: Eagles in the Ecosystem Classroom Jigsaw Activity
In this in-depth jigsaw activity, students investigate the role bald eagles play in the ecosystem, why they were listed as endangered, the effects of DDT on eagles, and the effects of lead on eagles. Furthermore, students will then graph...
US Department of Labor
Bureau of Labor Statistics:labor Force Statistics From Current Population Survey
Graph of the Civilian Labor Force, for past ten years. Accompanied by downloadable Excel chart. Links to current press releases and further information.
Alabama Learning Exchange
Alex: My Peanut Butter Is Better Than Yours!
The students will engage in the process of statistical data comparing data using tables and scatterplots. The students will compare data using measures of center (mean and median) and measures of spread (range). This lesson can be done...
Texas Instruments
Texas Instruments: Glencoe Middle School Science: Biodiversity and Ecosystems
Students will conduct a field investigation to learn about the environment. They will observe biotic and abiotic factors of an ecosystem. Students can use the CBL 2 and a temperature probe to collect data and a graphing calculator to...
Other
New Internationalist Magazine: Muslims: The Facts
Facts and statistical data of Muslim populations around the world. Includes geographical distribution of different groups and sectors.
Other
Mr. Dowling's Passport: Life Expectancy Around the World
From the CIA World Fact Book, this chart displays life expectancy statistics by country. Also links to data from the last two years.
Other
Statistics Education Web: Bubble Trouble [Pdf]
Use random sampling to formulate, collect, and compare data from two populations. Written by Peter Banwarth of Oregon State University.
Texas Instruments
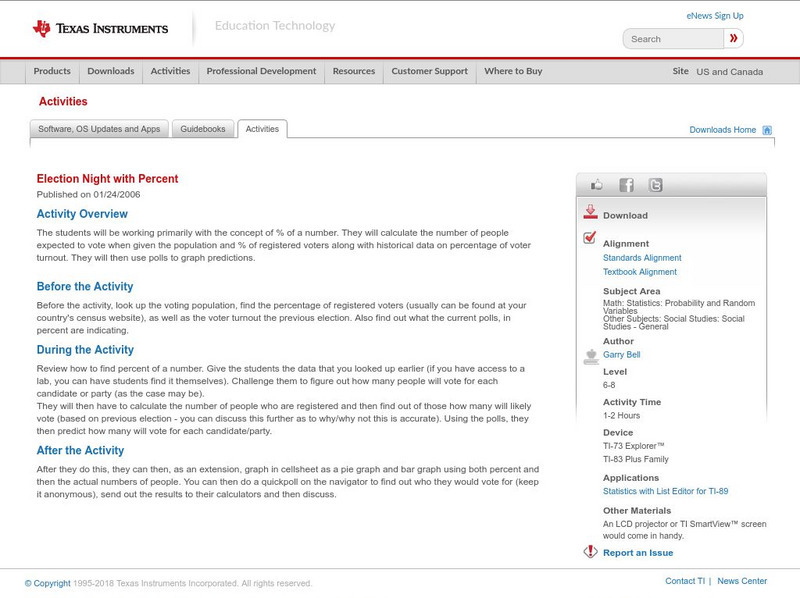
Texas Instruments: Election Night With Percent
The students will be working primarily with the concept of % of a number. They will calculate the number of people expected to vote when given the population and % of registered voters along with historical data on percentage of voter...
Illustrative Mathematics
Illustrative Mathematics: F Tf Foxes and Rabbits 3
Students are presented with two graphs that show the populations of foxes and rabbits in a national park over a 24-month period. This is the third Foxes and Rabbits task. In this more realistic problem, students must find functions that...









![Statistics Education Web: Bubble Trouble [Pdf] Lesson Plan Statistics Education Web: Bubble Trouble [Pdf] Lesson Plan](https://content.lessonplanet.com/knovation/original/715465-988c4be74f96df36c2d9bcb6f2f5182f.jpg?1661829195)
