Curated OER
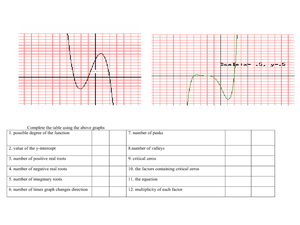
Polynomial Function Exam 4
In this polynomial learning exercise, students solve 12 questions. The first five questions deal with the roots of the polynomials. Students state the inverse for one problem and the reciprocal for one problem. They make three graphs,...
Curated OER
Functions and Inverses
Learners solve problems identifying the functions and inverses. In this algebra lesson, students identify a one-to-one function, and perform the horizontal line test. They analyze data and graph their results on a graph.
Curated OER
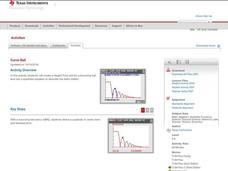
Curve Ball
Learners explore the concept of parabolas by collecting quadratic data on a bouncing ball as it is falling using a motion detector. They plot the data and determine the equation of the quadratic in vertex form, then determine the values...
Curated OER
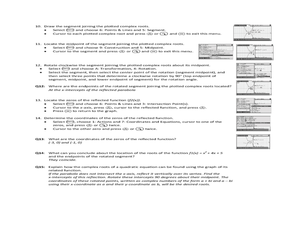
Complex Roots: A Graphical Solution
Using their Ti-Nspire to determine the solutions of parabolas, students explore the concept of complex roots. Students determine if parabolas have real or complex roots. Students determine the the axis of symmetry and the vertex given...
Alabama Learning Exchange
Technology for Displaying Trigonometric Graph Behavior: Sine and Cosine
Young scholars explore the concept of sine and cosine. In this sine and cosine lesson, students work in groups to graph sine and cosine functions. Young scholars examine how coefficients in various parts of each parent function shift...
Curated OER
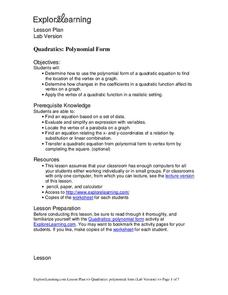
Quadratics: Polynomial Form
Students determine how to use the polynomial form of a quadratic equation to find the location of the vertex on a graph. They determine how changes in the coefficients in a quadratic function affect its vertex on a graph. Students find...
Curated OER
Introduction to Solving Quadratic Equations by Factoring
Students solve quadratic equations. In this algebra lesson, students factor and graph linear and quadratic functions. They identify the standard and linear form of each equation.
Curated OER
Linear-Quadratic Inequalities
Students graph linear and quadratic functions. In this algebra lesson plan, students create graph with specific coordinate points. They use the Ti to visualise and differentiate between the two functions.
Curated OER
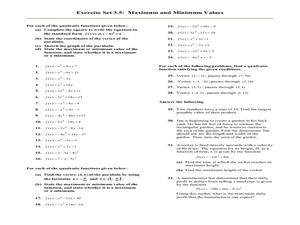
Maximum and Minimum Values
In this Algebra II worksheet, 11th graders complete the square to write a quadratic equation in Standard form. Students identify the vertex, sketch the graph and state the maximum or minimum value of the functions. The one page...
Curated OER
The Quadratic Formula
Students solve quadratic function by completing the square. In this algebra lesson, students use the quadratic formula to factor quadratics and find the roots. They graph the parabola and identify its properties.
Curated OER
Solving Quadratic Equations by Graphing
Learners solve quadratic equation by graphing. In this algebra lesson, students use the TI calculator to get a visual of their graph. They create a table of values, plot their points and graph the parabola.
Curated OER
Ball Toss Activity
Pupils collect data from tossing a ball into the air. Using a data collection device, they graph the data, set a window, and analyze the height of the toss, how long the ball was in the air, etc. They then find an equation that models...
Curated OER
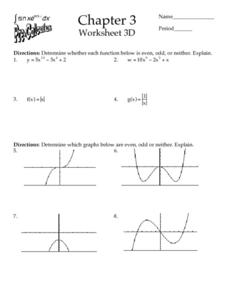
Chapter 3 - Worksheet 3D
In this pre-calculus worksheet 3D, students determine if a function is even or odd. They sketch graphs of functions and find the inverse of functions. This two-page worksheet contains 18 problems.
Curated OER
Linear Graphs and Patterns
Fifth graders find pairs of whole number co-ordinates and use them to draw graphs in problem contexts. They find and interpret the all meaningful pairs of whole number co-ordinates from graphs.
Curated OER
Worksheet 6, Graphing Functions
For this algebra worksheet students graph a given function by completing the square. They analyze a function and tell the axis of symmetry, the intercepts, and vertex. Students identify the maximum or minimum of a graph. Students...
Curated OER
Parabolic Paths
Students investigate properties of parabolas. In this algebra lesson, students identify the different paths of a parabola. They use the navigator to make observations of the parabola.
Curated OER
Solving Quadratic Equations
In this Algebra I/Algebra II instructional activity, students solve quadratic equations by graphing and by taking the square root of both sides. The two page instructional activity contains a combination five multiple choice and free...
Curated OER
Further Differentiation
In this further differentiation activity, students solve and complete 7 various types of problems. First, they sketch the graph of each equation using a stationary point. Then, students find the stationary points of each and describe...
Curated OER
Exploring Complex Roots
In exploring the concept of complex roots, students find the axis of symmetry and roots of parabolas. Then, they discuss what makes a solution complex and how to identify functions with complex roots.
Curated OER
Graphic Designing with Transformed Functions
Teach your class how to transform a graph! By identifying the domain and range of the functions, students can observe the parabola and find the vertex of the transformed graph.
Curated OER
Linear and Quadratic Approximations
Students explore a linear, a parabolic, and a log function. For this Algebra II/Pre-calculus lesson students investigate the graph a line, a parabola, and a log function. Students examine the three graphs as they compare and contrast...
Curated OER
Collecting And Fitting Quadratic Data
Students investigate the concept of using quadratic data to plot coordinates on a plane. They also apply the quadratic formula for a variety of problems with the help of a graphing calculator to draw the parabola for given coordinates.
Curated OER
Products of Linear Functions
Students investigate the horizontal intercepts of functions. In this algebra lesson, students identify whether the factor of two functions results in a quadratic equation or not. They compare and contrast linear equations and higher...
Curated OER
Inequalities 7.3
Graph inequalities and discuss the difference in their slopes. Learners observe rate of change as they compare linear, quadratic, and cubic functions.


