Curated OER
Determining the Density of a Liquid
Young scholars find the density of diet soda and regular soda. In this density lesson plan, students measure the mass of a graduated cylinder with 10 different volumes of each soda. They find the mass of the liquid alone and use the...
Baylor College
Heart and Lungs
With a partner, youngsters measure their pulse and breathing rates, both at rest and after running in place for a minute. While this activity is not novel, the lesson plan includes a large-scale classroom graphing activity and other...
STEM for Teachers
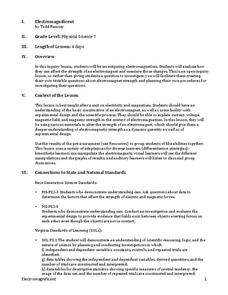
Electromagnificent
This physics pun really hertz, but this STEM lesson plan can help. The inquiry-based activity has young scientists create a testable question about electromagnetic strength; plan and implement their own experiments; and record and...
Curated OER
Chapter 15 Review, Section 2: Acid-Base Titration and pH
Keep it simple with this chemistry assignment. Learners examine an acid-base titration graph and answer four questions about the data. Then they will balance neutralization equations and calculate molarity for several specific solutions....
Curated OER
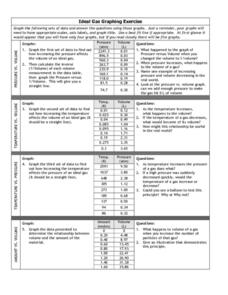
Graphing Exercise of Ideal Gas Data
For this graphing of Ideal Gas Data worksheet, students use the given data to draw 4 graphs of the given data. They are given the pressure and volume to draw and interpret the graphs.
Curated OER
Graphing Sea Ice Extent in the Arctic and Antarctic
Students graph sea ice data and predict long term trends in the data. In this climate change lesson, students use sea ice data from the Arctic and Antarctic to construct line graphs. They use their graphs to predict the effects of global...
Curated OER
How Many Frogs?
Students explore the concept of linear regression. In this linear regression lesson, students find the line of best fit for a set of data pertaining to a frog population. Students use their line of best fit to predict the frog population...
Code.org
Algorithms Detour - Minimum Spanning Tree
This optional lesson introduces the class to the idea of a minimum spanning tree. The activity focuses on determining an algorithm that will find the most efficient path in a network to transfer data.
Curated OER
Glenbrook South High School Science Scoring Rubric: Student Laboratory Reports
Here is an unexpected, but practical resource. It is not a learning exercise, but rather an outline of what a science laboratory participant should include in a report. Especially valuable is a grading rubric that spells out what is...
Curated OER
What's in the Water? - Stream Side Science
Here is a complete activity in which young biologists or ecologists test the pH, dissolved oxygen, turbidity and temperature of stream water. The class visits an actual stream and makes observations of the site. They use scientific...
Shodor Education Foundation
Scatter Plot
What is the relationship between two variables? Groups work together to gather data on arm spans and height. Using the interactive, learners plot the bivariate data, labeling the axes and the graph. The resource allows scholars to create...
Virginia Department of Education
Heat Loss from a Fur-Insulated Animal
How do animals adapt to weather changes? Provide your class with the ability to understand adaptations and body temperature as they participate in this hands on experiment, using fake fur and hot water. Pupils collect data and analyze...
Virginia Department of Education
Greenhouse Gas Modeling Activity
Why are greenhouse gases called greenhouse gases? Young Earth scientists learn about greenhouse gases though experimentation in the second installment of a 3-part series. They use lamps to model radiant energy as well as warming through...
University of Georgia
Heating and Cooling of Land Forms
Compare heating and cooling rates of different land forms. A lab activity has groups collect data on the rate of heating and cooling of soil, grass, saltwater, fresh water, and sand. An analysis of the rates shows how the different land...
InqueryPhysics
Interpreting Motion Graphs
Every movement in the world can be measured and even motionless objects can be significant indicators of movement. Focus on motion graphs that feature distance vs. time, speed vs. time, and positive and negative acceleration.
National Wildlife Federation
Who Can Live Here?
Not all species can survive in all habitats. Using specific criteria, learners assess the fitness of a local habitat to a specific species. They collect data and suggest enhancements to create a suitable habitat for their chosen species.
Las Cumbres Observatory
Star In a Box
Stars may all look the same from down here, but their surfaces tell a different story. Using an animation, learners collect data about the temperature and luminosity of stars and compare them to their mass and radius. They then answer...
Curated OER
Using My Nasa Data To Determine Volcanic Activity
Students use NASA satellite data of optical depth as a tool to determine volcanic activity on Reunion Island during 2000-2001. They access the data and utilize Excel to create a graph that has optical depth as a function of time for the...
Curated OER
Using SWMP Data
Students are introduced to the SWMP system which tracks short-and long-term changes in water. Using this data, they plot and interpret the data on a graph to determine how human activities are lowering the water quality. They also...
Curated OER
Which Fish Where?
Here is a lesson outline that prompts elementary learners to graph and analyze data regarding fish caught along the Hudson River. They will review vocabulary and complete 2 worksheets which can be accessed by clicking on the provided links.
Curated OER
Cool Liquids
Chemistry neophytes use a temperature probe to assess the change as five different liquids evaporate. The implantation section suggests that they take readings every five seconds for a total of four minutes. They graph the data, look up...
Curated OER
Feeding in the Flow
The National Oceanic and Atmospheric Administration (NOAA) has developed a tremendous library of ocean-themed lessons that can be used in a variety of science settings. "Feeding in the Flow" is one of those activities; Its focus is on...
UT Southwestern
Osmosis Demonstration Lab
Even though they were written for upper-level high schoolers or college pupils, the labs herein are possible to use even in middle school. In the activity, kids observe osmosis in both potatoes and elodea plants, then record and graph...
Curated OER
Graphing in an Experimental Context
Seventh graders discuss the importance of being able to represent scientific data in the form of graphs. They comprehend the differences between a bar graph and a line graph. Students identify the type of data with which each graph...


