Curated OER
Motion on an Inclined Plane
In this physics worksheet, students model the acceleration, velocity, and position of a cart moving up an inclined plane. They take data and determine a pattern in the data. Students also describe their findings and create an illustration.
Curated OER
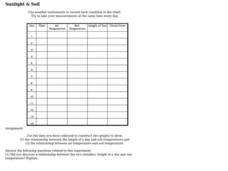
Sunlight & Soil
In this earth science worksheet on sunlight and soil, learners use data collected in a chart to construct two graphs. Following, they answer five questions as they relate to the experiment performed.
Curated OER
One Plus One Makes New
Students discover the properties of matter and how they change when composite materials are produced. In this informative lesson students write up a question and procedure to an experiment then analyze and draw conclusions based on the...
Curated OER
Science and Technology
Students research inventions that have been created. In this historical technology lesson, students read the Harcourt Brace social studies textbook and discuss how inventors used graphs to display data. Students create a table to write...
Curated OER
Climate Systems - Which Location Is Best For Me?
Students study the difference between weather and climate. In this climate systems lesson students search the Internet for the parts of the Earth's system, gather climate data and complete a challenge scenario.
Curated OER
Hand Sensitivity
Students experiment with the sense of touch. In this tactile lesson, students determine the most sensitive area of the hand. Students experiment by describing objects through touch only. Students compare the amount of sensory data...
Curated OER
Probing Under the Surface
Eighth graders use a measuring stick to determine the shape of the inside of the bottom of a box, then apply their knowledge to an additional situation. This task assesses students' abilities to make simple observations, collect and...
Curated OER
Bell Curve
Students explore averages by completing a data analysis activity. In this bell curve lesson, students measure different food items and plot their measurements on a X and Y axis. Students create bell curves around the average weight or...
Curated OER
Graphing Changes in Weather
Students graph current temperature and weather conditions for three days. For this weather lesson, students go to the Weather Channel's website and look up weather for their zip code then graph the conditions and record the current...
Curated OER
Differences between Climate and Weather
Learners collect weather data over weeks, graph temperature data and compare the temperature data collected with averaged climate data where they live.
Curated OER
Does Cloud Type Affect Rainfall?
Student uses MY NASA DATA to obtain precipitation and cloud type data. They create graphs of data within MY NASA DATA. They compare different cloud types as well as precipitation types. They describe graphs of the precipitation and cloud...
Curated OER
Seasonal Cloud Cover Variations
Young scholars, in groups, access data from the NASA website Live Access Server regarding seasonal cloud coverage and the type of clouds that make up the coverage. They graph the data and make correlations between types, seasons and...
Curated OER
World Population Activity II: Excel
Students import UNEP World population data/projections from either the World Population Prospects: The 2002 Revision Population Database - UN Population Division or a text file. They graph this data by itself, and then along with...
Curated OER
At the Edge of the Continent
Students study how to interpret a bathymetric map. They study the main features of the continental margin. They plot and graph bathymetric data. They think about and discuss the bathymetry of the edge of the cont
Curated OER
Bottle Habitat
In groups of four, students construct aquatic habitats in pop bottles. They create charts and record data from observations over a four week period. Then they graph their data and write explanations for what they observed.
Curated OER
Graphing of Time and Distance
For this graphing time and distance worksheet, students graph data of a two race cars as they drive over time. Students plot the time vs. the distance for both cars and answer questions about the data. They determine the speed of the...
Curated OER
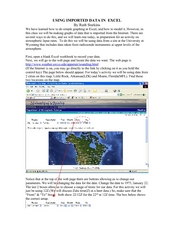
Using Imported Data in Excel
Students import atmospheric data from the internet. In this earth science lesson, students graph the data they collected. They complete the worksheet after the activity.
Curated OER
A Sweet Drink
Students investigate reaction rates. In this seventh or eighth grade mathematics lesson, students collect, record, and analyze data regarding how the temperature of water affects the dissolving time of a sugar cube. Studetns determin...
Curated OER
Graph a Panther's Diet
Pupils examine the diet of panthers. In this interpreting data instructional activity, students collect data on the panther's diet and chart the data in bar and pie graphs.
Curated OER
Growing Plants
Students grow plants and track their growth over time. For this growing plants lesson, students plant seedlings and chart their growth in a data analysis activity.
Curated OER
Cloud Types
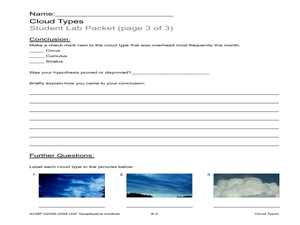
Students examine cloud types. In this cloud lesson, students identify cloud types, observe clouds and collect data, and analyze data to identify the most common cloud they observe overhead during the course of a month.
Curated OER
Is It There?
Students participate in a lesson designed to illustrate these concepts using simple materials. They use Science process skills to observe, measure, predict, make inferences, and communicate while completing the activity. Proper safety...
Curated OER
Science: Evidence for Global Warming
Young scholars examine the evidence for global warming and its causes. They analyze mean temperature data of a location for two twenty-year time periods (1891-1910 and 1981-2001). Students also assess atmospheric CO2 concentrations and...
Texas Instruments
Finding Linear Models Part III
Explore linear functions! In this Algebra I lesson, mathematicians graph data in a scatter plot and use a graphing calculator to find a linear regression and/or a median-median line. They use the model to make predictions.


