Sea World
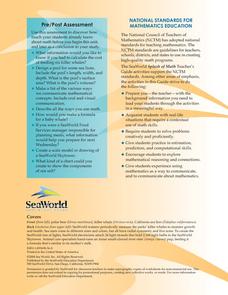
Splash of Math
How can kids use math to learn about marine life? Combine math skills with science lessons in a resource featuring activities about life in the sea. Kids graph and calculate data, solve complex word problems, measure geometric shapes,...
National Park Service
Weather Patterns of the Pacific Ocean
How do oceans affect weather patterns? Learners define vocabulary associated with dew point, topographical lifting, condensation, and formation of clouds and precipitation as they explore the weather in the Pacific Northwest. They also...
Curated OER
Graphing the Elephant Seal Population Data
Young scholars are able to graph data that they generated in the elephant seal exercise using proper format and labeling. They are able to interpret the graphs they created and make A) conclusions, and B) predictions based on that graph.
Curated OER
Rain Forests: A Disappearing Act?
Students examine and locate rainforests on maps, and research the patterns of their destruction. They develop a bar graph of rainfall and temperature data, write a journal entry, and research the people, animals, and plants/products of...
Michigan Sea Grant
What's in This Water?
Pupils investigate the biological and chemical characteristics of water to determine where purple loosestrife occurs. They create data sheets to record water quality tests in several locations and work in groups to conduct the water...
Curated OER
What's Cooking?
Students investigate solar energy by making sun tea. In this ecology and solar energy lesson, students prepare traditional tea and "sun" tea, then record and graph data comparing color, clarity, smell and taste.
Curated OER
Blast Off
In this physical science exploration, small groups place a piece of antacid tablet into a film canister and step back to time how long it takes for the top to pop. They repeat the activity, altering either the amount or temperature of...
Curated OER
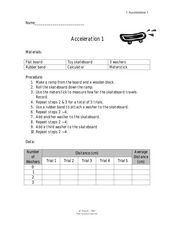
Acceleration 1
In this acceleration worksheet, students use weights to increase the mass affecting the force on moving objects. Students plot a graph of their data and answer 3 questions about how the acceleration of the toy skateboard used in the...
Curated OER
Graphing the Standard Curve
Learners analyze colorimetric using a computer program. In this science lesson, students show application of standard curves by finding other areas of science where standard curve is analyzed.
Curated OER
Analysis of Atmospheric Conditions for a High Mountain Retreat
Students examine the relationship between altitude, atmospheric pressure, temperature and humidity at a particular location. They practice science and math in real world applications. They write reports detailing their scientific...
Texas Instruments
Data Collection for Bar Graphs
Learners study the concept of central tendency in this data collection for bar graph lesson. They collect data outside as instructed and organize it into a bar graphs, then they list in specific groups the labels that appear on the...
Curated OER
Collect Data Using a Transect Line
Middle schoolers learn about transect lines through a study of marine debris. In this marine debris lesson, students calculate the items on a transect line and graph them. Middle schoolers complete a category worksheet.
Curated OER
More Rocket Science
Young scholars observe two rocket science experiments, and create a graph to demonstrate the results. They draw a picture and write an explanation of the results of the experiments.
Curated OER
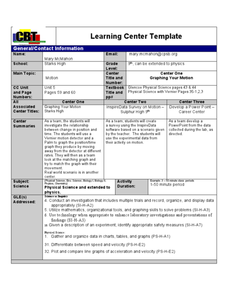
"Graphing Your Motion"
Students study the concepts of motion, velocity, and acceleration through graphing their own movement using LoggerPro. They explain the difference between speed and velocity using the weather vane example. They discover the difference...
Curated OER
Using a Database in Science Experiments
Fifth graders plant and take care of a lima bean plant and make predictions on its growth. In this science lesson, 5th graders chart their records and make conclusions about their experiment.
Curated OER
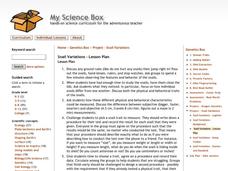
My Science Box: Snail Variation
Learners observe snails and their characteristics. In this science instructional activity, students decide how to measure their snails and to observe a behavioral trait. Learners create a graph to present their findings.
Curated OER
Biospheres in Your Backyard
Students collect data from a local river biome. They use the information for metric conversion and graphing equations. They study the components of what makes up a biosphere and how math is used to analyze one.
Curated OER
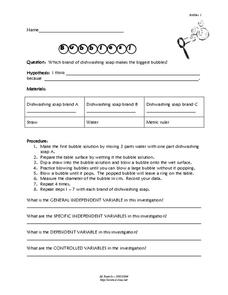
Bubbles
Young scholars experiment bubbles. In this scientific method lesson, students identify variables used in proper experiment design. Young scholars conduct experiments with different brands of dish-washing detergent to determine which...
Curated OER
Chucky Chickadee's Bird and Breakfast: Sing in Please
Students observe bird feeding and complete a tally and graphing activity for their observations. In this bird graphing lesson plan, students work in teams to observe bird feedings. Students complete a bird reporting sheet and collect...
Curated OER
Analyzing Motion of a Tossed Ball
Students investigate the parameters involved with launching a basketball at an angle. In this motion lesson students predict and sketch graphs that show the motion of a ball toss.
Curated OER
Effects of Temperature, Deviation on Climate
Young scholars collect and record data for a given city. They calculate standard deviation of temperature and analyze the impact of climate changes on a city's and culture.
Curated OER
Bigger Better Bubbles
Students research different types of bubble gum and identify the variables in them. In this bubble gum lesson students design an investigation to test their hypothesis and graph their data.
Curated OER
Countdown to Disaster
Students discover the potential dangers of weather in their hometown. In this environmental lesson, students research Hurricane Hugo and the devastation it caused South Carolina in 1989. Students record weather data from their city and...
Curated OER
Volcano Spreadsheet and Graph
Fourth graders use data from volcanoes to organize a spreadsheet and make a graph.


