Curated OER
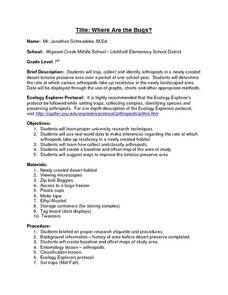
Where Are the Bugs?
Students trap, collect and identify arthropods in a newly created desert tortoise preserve area over a period of one school year. They determine the rate at which various arthropods take up residence in the newly landscaped area. Data is...
Curated OER
Investigating Properties of Water: Temperature
Investigate how temperature affects the density of water and stratification that occurs in bodies of water when temperatures vary. Water of differing temperatures is given different colors to see the layers that form. The lesson plan is...
Curated OER
How Does Your (Coral) Garden Grow?
Analyze and graph oxygen isotope ratios in coral samples in relation to the distance from the outer skeleton edge. Compare the data to the mean monthly water temperatures. Uncover whether or not there is any correlation. In addition to...
Curated OER
Human Fingerprints: No Two The Same
Learners will be offered numerous opportunities to further enhance their observational skills as well as the integration of math with their continual exposure to the metric system, measurement, and graphing to represent their data....
Curated OER
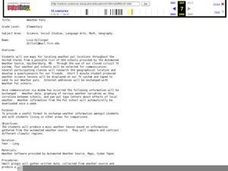
Weather Pals
Young scholars study maps of the United States to locate weather pals from a list of schools. They communicate with Weather Pal schools through the use of closed circuit TV. Using weather data collected in their area, they exchange the...
Curated OER
Boyle's Law
After viewing this PowerPoint, physical science learners will be able to apply Boyle's law. Background information, reasoning, and data will help in understanding the behavior of gases. There are a few slides that require pupils to...
Curated OER
Growing a Seed
Seeing how seeds grow into plants is such an enjoyable for students! They plant lima bean seeds and take pictures to record the growth of their plants. Students write in a journal to describe their daily observations of their plants, and...
Curated OER
Stator limbatus Study, Part 1
Second graders experiment identifying beetle emergence and exit holes in seeds, count them, look for beetle eggs with a magnifier and count how many beetle eggs they find. They then graph on a data sheet the findings from their research.
Curated OER
Team Apollo
Seventh graders brainstorm about problems with a school track. They research different possibilities for a solution. They test different track materials with erosion, durability, abrasiveness and resiliency. They determine the area,...
Curated OER
Carbon Monoxide and Population Density
Tenth graders investigate the carbon monoxide level at a fixed latitude to determine if there is a relationship to population density. They download data sets and generate a graph, and find locations using the Earth's coordinate system....
Texas Instruments
Light and Day
Pupils explore the concept of collecting data as they collect data on their graphing calculator about time, temperature, and light. Learners plot the data and create histograms and box and whisker plots to analyze the data.
Curated OER
Name That Tune: Matching Musical Tones Through Waveform Analysis
Pupils detect the waveform of musical notes to determine the code for the "safe" in this forensics simulation lesson. They use a microphone and tuning forks along with Vernier EasyData on their graphing calculator to analyze five musical...
Curated OER
Human Population Growth
In this human population growth worksheet, learners create a graph of human population growth and predict future growth using the data given in a chart. Students identify factors that affect population growth.
Curated OER
The Weather Around Us
First graders explore weather patterns. In this weather lesson, 1st graders research the daily weather by creating a graph of the daily weather conditions. Students use the computer to access information regarding the weather forecast....
Curated OER
The Life Cycle of the Mealworm
Fourth graders provide a habitat for live mealworms and observe their life cycle. In this animal life cycle and scientific inquiry lesson plan, 4th graders create a habitat for a live mealworm and observe and record related data as it...
Curated OER
Density Graph Questions
In this density worksheet, students use the mass of aluminum and copper at different volumes to create a graph in order to calculate the density of these metals. This worksheet has 1 graph, 2 short answer, and 5 word problems.
Curated OER
Global Meltdown
In this environmental science lesson, students study data and animation on global temperature increase to complete 8 short answer questions that follow.
Curated OER
Connecticut Wildlife: Biodiversity and Conservation Status of Our Vertebrate Populations
Students explore the different types of vertebrates found in their area. In this environmental science lesson, students perform a case study on the Common Raven. They analyze data collected from research and create charts and graphs.
Curated OER
Chances Are
Upper graders examine the concept of probability. They collect data and create a bar graph. They must interpret the data as well. Everyone engages in hands-on games and activities which lead them to predict possible outcomes for a...
Discovery Education
Mood Music!
Grouchy? Sad? Here's a great resource that shows kids how music can be used to lift their spirits. Kids collect and chart data on the effects of music on emotions. After analyzing the results of their experiment, they develop their own...
Foundation for Water & Energy Education
How is Flowing Water an Energy Source? Activity A
Here is a fun little exploration of the potential energy potential of falling water. Learners drop water from various heights using a straw, and they analyze the diameter of the splash. Pair this with two more activities of the same...
Curated OER
Get a Leg Up
Traveling through space is an amazing experience, but it definitely takes a toll on the body. After reading an article and watching a brief video, learners perform an experiment that simulates the effects of zero gravity on the human body.
Curated OER
Velocity of Traffic on Highway 26
Physics fanatics time five cars as they pass on the highway. They use the times and a 20-yard distance to calculate velocity. They also graph distance vs. time. A page of student pre-lab questions is provided in addition to the activity...
Curated OER
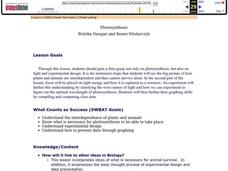
Photosynthesis
Students recognize the importance of plants as they perform an experiment involving photosynthesis. Students determine the optimum wavelength of light for photosynthesis by exposing plants to different colors of light, collecting data,...


