Curated OER
Collect Data Using a Transect Line
Middle schoolers learn about transect lines through a study of marine debris. In this marine debris lesson, students calculate the items on a transect line and graph them. Middle schoolers complete a category worksheet.
Curated OER
More Rocket Science
Young scholars observe two rocket science experiments, and create a graph to demonstrate the results. They draw a picture and write an explanation of the results of the experiments.
Curated OER
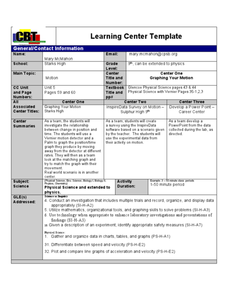
"Graphing Your Motion"
Students study the concepts of motion, velocity, and acceleration through graphing their own movement using LoggerPro. They explain the difference between speed and velocity using the weather vane example. They discover the difference...
Curated OER
Graphing Speed
In this graphing worksheet, students read about independent and dependant variables and learn how to determine speed from the slope of a position vs. time graph. This worksheet has 4 matching, 17 fill in the blank, and 2 problems to solve.
Curated OER
Graphing Speed; Slope
In this graphing speed worksheet, students find the slope in a position vs. time graph to be the speed. They are given example graphs of position vs. time to show the changes in slope reflect the changes in speed. Students match terms...
Curated OER
Using a Database in Science Experiments
Fifth graders plant and take care of a lima bean plant and make predictions on its growth. In this science lesson, 5th graders chart their records and make conclusions about their experiment.
Curated OER
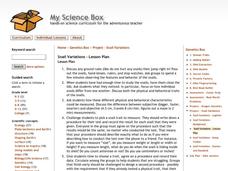
My Science Box: Snail Variation
Learners observe snails and their characteristics. In this science instructional activity, students decide how to measure their snails and to observe a behavioral trait. Learners create a graph to present their findings.
Curated OER
Biospheres in Your Backyard
Students collect data from a local river biome. They use the information for metric conversion and graphing equations. They study the components of what makes up a biosphere and how math is used to analyze one.
Curated OER
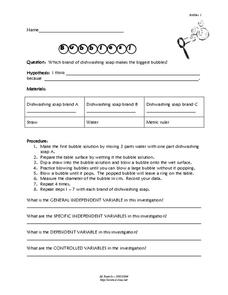
Bubbles
Young scholars experiment bubbles. In this scientific method lesson, students identify variables used in proper experiment design. Young scholars conduct experiments with different brands of dish-washing detergent to determine which...
Curated OER
Chucky Chickadee's Bird and Breakfast: Sing in Please
Students observe bird feeding and complete a tally and graphing activity for their observations. In this bird graphing lesson plan, students work in teams to observe bird feedings. Students complete a bird reporting sheet and collect...
Curated OER
Analyzing Motion of a Tossed Ball
Students investigate the parameters involved with launching a basketball at an angle. In this motion lesson students predict and sketch graphs that show the motion of a ball toss.
Curated OER
Effects of Temperature, Deviation on Climate
Young scholars collect and record data for a given city. They calculate standard deviation of temperature and analyze the impact of climate changes on a city's and culture.
Curated OER
Bigger Better Bubbles
Students research different types of bubble gum and identify the variables in them. In this bubble gum lesson students design an investigation to test their hypothesis and graph their data.
Curated OER
Countdown to Disaster
Students discover the potential dangers of weather in their hometown. In this environmental lesson, students research Hurricane Hugo and the devastation it caused South Carolina in 1989. Students record weather data from their city and...
Curated OER
Volcano Spreadsheet and Graph
Fourth graders use data from volcanoes to organize a spreadsheet and make a graph.
Curated OER
Graphing Sunspot Cycles
Students explore sunspots and then graph them to analyze the data. In this sunspot cycles lesson students complete an activity sheet and complete questions.
Curated OER
Where do Plants Get their Food?
In this where do plants get their food worksheet, students design an experiment that will disprove the idea that plants obtain their food from soil. Students will set up their experiment and design a data table that will record data over...
Curated OER
2nd Grade - Act. 28: Calendar & Weather Book
Second graders will track the weather patterns throughout the school year. This project spans the school year and takes five minutes per day or less. Measuring, data collection, and predictions are all explored throughout this relevant...
Science 4 Inquiry
Atmospheric Layers
Space diving refers to the act of jumping from outer space and falling through Earth's atmosphere before parachuting to land. Scholars learn about this extreme activity and study the layers of the atmosphere they must conquer in the...
Curated OER
Get a Half-Life Student Worksheet
Young scientists use a worksheet to help them perform a lab on the decay of a radioactive element. The worksheet serves as both a task guide and a lab sheet for pairs of learners. This activity requires a calculator and has excellent...
Teach Engineering
Solar Power
Elementary schoolers discover how engineers use solar energy to heat buildings. They take a close look at some of the materials used: sand, salt, water, and shredded paper and evaluate the efficiency of each material. An incredible...
Center Science Education
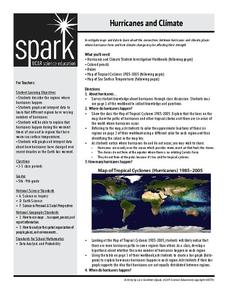
Hurricanes and Climate
Feeling under the weather? This lesson on hurricanes can whip things up! With professionally designed maps and handouts, teach your future weathermen (or women) where, when, and how hurricanes occur. They identify hurricane regions and...
Alabama Learning Exchange
How Big Can a Bee Be?
Mathematicians analyze the relationships between surface area and volume. They conduct Internet research, conduct various experiments, record the data in a spreadsheet, and graph the results and compare the rate of increase of surface...
Curated OER
Global Warming Statistics
Students research real-time and historic temperature data of U.S. and world locations, and analyze the data using mean, median, and mode averages. They graph the data and draw conclusions by analyzing the data. A spreadsheet is used to...


