Rainforest Alliance
Forests of Guatemala
With 90 percent of its land area covered in forests, Suriname, a country in South America, contains the largest percentage of forests throughout the world. Here is an activity that brings classmates together to learn about the...
Virginia Department of Education
Radioactive Decay and Half-Life
Explain the importance of radioactive half-life as your high school biologists demonstrate the concept by performing a series of steps designed to simulate radioactive decay. Pupils use pennies to perform an experiment and gather data....
Virginia Department of Education
A-Mazing Plants
Have your young scientists questioned why plants grow a particular way? Through this learning opportunity, scientists gain firsthand knowledge about how plants develop and various factors that affect rates of growth as they bring plants...
STEM for Teachers
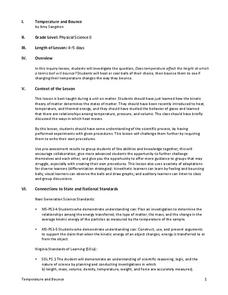
Temperature and Bounce
Take part in a fun experiment and hold an impromptu bouncing contest with your class. Young scientists heat and cool balls before bouncing them to determine whether temperature changes affect how they bounce. The set of STEM lesson plans...
Virginia Department of Education
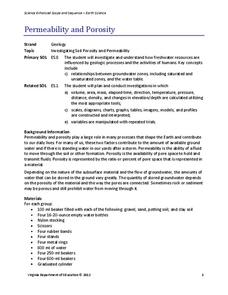
Permeability and Porosity
Covering both permeability and porosity, scholars perform a hands-on experiment testing various soil types. The material includes a pre-lesson worksheet to help focus pupils on the task at hand.
Curated OER
Evaporation Experiment- Desert Science Graph
In this science worksheet, students make a bar graph about desert evaporation. The directions say to use the "data from your recording data page" to display information on the graph.
Curated OER
Mountain of Ice
Students graph and analyze chemical concentrations from ice core data. In small groups they prepare their graphs using colored pencils, and discuss the results.
Curated OER
What Pie?
Students practice making and interpreting pie graphs so they are better able to decide if a pie chart is the appropriate form of display. Students examine included overheads of different pie charts, and directions on how to make pie...
Curated OER
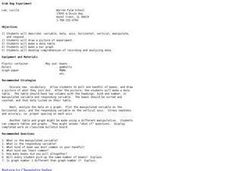
Grab Bag Experiment
Students analyze and record data. In this lesson about graphing and gathering data, students learn about the step of an experiment. Students learn new vocabulary, sort beans, record the data, and graph the data. Students add a variable...
Curated OER
Measuring and Recording Weather
Students examine instruments used to measure weather, record the data, and post it to an online weather report. They include a 24 hour prediction, keep a weather log, and graph the data.
Curated OER
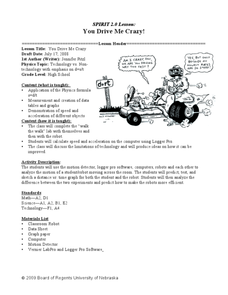
You Drive Me crazy
Students calculate the distance and acceleration of an object. In this algebra lesson, students collect data and create table and graphs to analyze it. They complete a lab as they collect and analyze data on acceleration and distance.
Curated OER
Seed Growth
Students develop an independent procedure to investigate the germination of two types of seeds. Students must construct data tables or charts to record observations and results, graph the data, and analyze the data.
Curated OER
Circuits
Students draw a schematic diagram of parts needed to build an op-amp. In this physics lesson, students test the operation of their machine. They graph and analyze data using excel.
Curated OER
Tree I.D.
Students explore various tree species. In this tree species instructional activity, students collect leaves on nature walks and use Internet sources to identify the trees that the leaves belong to. Students graph their data as well.
Curated OER
Texas Estuary Project
Students take a field trip to a local estuary and analyze water samples. They analyze and graph the data results, write an essay, and create a food web of their field site.
Curated OER
Heating of Water: Water Vapour
Seventh graders read the directions printed on their worksheet and follow them carefully. They set up a beaker with a tripod and Bunsen burner under it. They record the temperature of water every 30 seconds. Students graph the data and...
Curated OER
Who's Got Your Power
Students examine and map local sources of energy. They conduct Internet research on their local utility company, identify where their utility company obtains energy, graph the data, and label a map of power plant locations in their state.
Curated OER
Scientific Method
In this science instructional activity, students identify and locate each of the words to the right in the word search puzzle on the left. Then they list as many words as they can from the letters in scientific method.
Curated OER
Scatter Plots
In this Algebra I/Geometry/Algebra II worksheet, learners create a scatter plot and analyze the data to determine if the data show any type of correlation. The four page worksheet provides extensive explanation of topic, step-by-step...
Curated OER
Quick Stats with Quick Poll
Learners analyze data using bar graphs and the TI in this statistics instructional activity. They investigate quick polls and graph the data using different properties of statistics. This assignment requires a TI Navigator.
Curated OER
The Bouncing Ball
Students use the scientific method to conduct an experiment to test how a ball bounces. In this inquiry-based physical science and scientific method lesson, students drop a ball from specified heights and record the rebound, then record...
Curated OER
Global Warming Statistics
Learners research and collect data regarding temperature changes for a specific location and find the mean, median, and mode for their data. In this climate change lesson plan, students choose a location to research and collect data...
Curated OER
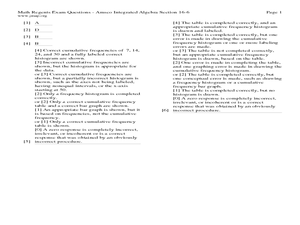
Quartiles, Percentiles, and Cumulative Frequency
In this statistics lesson, 11th graders are asked to calculate the percentiles, quartiles and cumulative frequency given different graphs and data. There are 6 questions with an answer key.
Curated OER
Pika Chew
Students work in collaborative teams with specific roles, use the Internet to research the behavior and ecology of pikas, make predictions about survival rates of pikas in different habitats and organize their data in graphs.


