Captain Planet Foundation
Shape Shifters in the Math Garden
Combines mathematical measurement with gardening skills. Third graders hunt for worms in the garden and try to find the longest one. They also measure and weigh vegetables that they harvest from the garden, measure rainfall amounts, and...
Curated OER
Aruba Cloud Cover Measured by Satellite
Students analyze cloud cover and compose written conclusions to a given related scenario. Students submit a letter of response and a report detailing their calculations and conclusions.
Curated OER
Highs and Lows
Plot data using the number line and discuss how negative numbers are used in math and science. Sixth and seventh graders share their graph with the class and provide an explanation for their plotting.
Curated OER
How Alike Are We?
Fourth graders find the range, mode, median, and mean for each of the data sets (height and shoe size). They discuss which measure of central tendency for each data set best represents the class and why. Students graph the shoe size and...
Curated OER
Baseball Stats
Students explore data sheets and statistics in baseball. They use baseball data available on the Internet to develop an understanding of the different ways in which data can be analyzed.
Curated OER
Algebra 1
Students study the functional relationships of a variety of problems. In this functional relationship lesson, students determine the dependent and independent quantities of a given set of data. Students record the data and write it in...
Curated OER
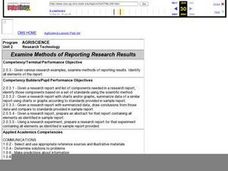
Examine Methods of Reporting Research Results
Students analyze a research report and the list of components needed in a research report and then identify those components based on a set of standards using the scientific method. They collect data which can be used for a graphical...
Curated OER
I Wonder How Fast Manduca Grows Compared To Me
Students study the Manduca bug and its growth data. They look for patterns and compare their own growth rate to that of the Manduca.
Curated OER
Old Glory
Learners utilize mathematical concepts such as: measurement, ratio and proportion and geometric probability to analyze the components of the U.S. Flag. They collect, organize and interpret data by constructing charts, tables and graphs...
Curated OER
Probability and Applications of Simulations
Middle schoolers apply properties of probability to the real world. In this probability lesson plan, learners simulate the construction of empirical distribution. They collect and analyze data using central tendencies.
Curated OER
Exploring Circles
Students explore circles using a graphing calculator. For this circles lesson, students write the equation of a circle with a given center and radius length. Students find the most appropriate model for each combination of data they...
Curated OER
Laws of Motions
Seventh graders explore the Laws of Motion. They define friction and explain the concept of inertia. Students explain what happens when a force is exerted on an object that is in equilibrium. They state the second and third laws of motion.
Curated OER
The Survey Says
Young scholars experience the development of statistical data. In groups, they construct a survey questionnaire for a target audience. Students produce the questionnaire, distribute it, collect it, and tabulate the data. Using EXCEL,...
Curated OER
Measurement: Stream Flow & Stadium Capacity
Eighth graders study the scientific fields and how information can be monitored and recorded. For this scientific inquiry lesson students view a PowerPoint presentation and complete a hands on activity.
Curated OER
How Times Have Changed
Fifth graders work in small groups to compile job changes. They use data from the list of changes that the group generated together. Students analyze the data to determine: categories of changes, patterns or trends of changes, and future...
Curated OER
Journal of the Stars
Students receive balloons representing the "Life Cycle of the Stars." As the attached script is read, students follow the directions for the color of balloon they are given. Students chart the results for their star. They plot data from...
Curated OER
Great Tasting Shapes
Fifth graders investigate the concept of median, mode, and range using a simple model for display purposes. They examine different shaped crackers out of a box and identify the ones that occur the most. Then the calculations for the...
Curated OER
Saving Energy Through Ecological Landscape Design
Students are able to transcribe to scale the plant features of a common landscape. They determine true north and south and collect and record data on a table. Students calculate a rating for and describe a definition of insulation and...
Curated OER
Creating a Bar Graph with a Graphing Program
Students use the S'COOL data base to create a bar graph.
Curated OER
Graphing and Analysis of Water Quality Reports
Students practice making graphs and interpreting them. They compare and contrast different sets of data. They use Microsoft Excel to create different types of graphs.
Curated OER
Work-Kinetic Energy Theorem
Students prove the validity of the Work-Kinetic Energy Theorem by analyzing the Car and Driver website which lists qualitative and quantitative data about an assigned car. They decide whether or not they would purchase the car based on...
Curated OER
Calculating & Graphing Using a Spreadsheet
Students use the lab apparatus to calculate the average velocity and average acceleration at several points and record the data. They use the spreadsheets to plot distance vs. time, velocity vs. time and acceleration vs. time graphs.
Curated OER
Spreadsheets in Science
Fourth graders create spreadsheets, explore patterns and make predictions based on the information. They select the appropriate graph to display the spreadsheet data. They search and sort prepared data bases to gain knowledge for...
Curated OER
Creating and Analyzing Graphs of Tropospheric Ozone
Students create and analyze graphs using archived atmospheric data to compare the ozone levels of selected regions around the world.


