Curated OER
As a Matter of Fact
Elementary-aged scientists discover that all matter has mass. They are shown the difference between mass and weight, and learn how to calculate mass using the appropriate tools and methods. The scientific method is used while estimating...
Global Change
Impact of Climate Change on the Desert Pupfish
A fish that lives in the desert? You and your class can meet the desert pupfish as they examine its habitat, the role humans play in diminishing water supplies, and how climate change might impact this fishy friend. There are four short...
NASA
Just How Far is That Star?
Pupils often wonder how we know the distance to various stars. Starting with a thought experiment and progressing to a physical experiment, they determine the brightness and distance to various stars. The evaluation requires critical...
World Wildlife Fund
Land of the Midnight Sun
From days of 24 hour sunlight, to endless nights that last for days, the Arctic is a very unique place to live. Examine the seasonal changes that occur in the northern-most reaches of the globe and the impact they have on the plants and...
Creative Learning Exchange
The Infection Game: The Shape of Change
Encourage the spread of knowledge in your class with this cross-curricular epidemic simulation. Pulling together science, social studies, and math, this lesson engages students in modeling the spread of infectious diseases, collecting...
Curated OER
The Effect of Math Anxiety on Cardiovascular Homeostasis
Using a pulse monitor, learners will measure a resting pulse, take a math test, and then measure the pulse again. They analyze the change in pulse and compare it to performance on the test. This multi-purpose lesson can be used in a...
Space Awareness
Star in a Box
What happens to stars as they get older? A simulation takes pupils through the life cycle of stars based on their masses. The resource introduces the Hertzsprung-Russell diagram and the common relationships and life cycle patterns observed.
American Museum of Natural History
Rising CO2! What Can We Do?
It is colorless and scentless, but it makes a large impact on the environment. Learners explore carbon dioxide emissions and what they mean for the environment using an interactive graph. They review changes over time and how they impact...
Teach Engineering
Pointing at Maximum Power for PV
Following detailed directions, teams collect the voltage and current outputs of a photovoltaic cell by adjusting the resistance. Using the collected data, they determine the highest power output. Implications for weather and a large...
Illustrative Mathematics
US Garbage, Version 1
An interesting example of a discrete function and how it is applies to the real world. This could easily make a good collaborative lesson with an environmental science class. Practice reading a table and drawing a scatter plot make up...
Wild BC
Bearly Any Ice
After reviewing food chains, your class members participate in an arctic predator-prey game that exemplifies the impact of climate change of food availability. If you are in a hurry, skip this lesson, but if you have the time to...
Curated OER
Leaves, the Sun, and the Water Cycle
As a way to combine life and physical science, or simply as an investigation of plant transpiration, this lesson is sure to inspire! Middle schoolers capture the moisture given off by plants that are placed in different conditions. They...
Shodor Education Foundation
Skew Distribution
Slide the class into a skewed view. Learners alter the location of the median relative to the mean of a normal curve to create a skew distribution. They compare the curve to a histogram distribution with the same skewness.
Teach Engineering
Air Pressure
Investigate what is pushing on us. An intriguing activity has pupils calculate the amount of force on various squares due to air pressure. Using the data, individuals create a graph in the third activity of the Up, Up and Away unit...
Curated OER
Nutria And The Disappearing Marsh
Young analysts examine changes in the nutria population, vegetation density, and marsh area over time in the wetlands of Louisiana. They import data and use the TI-73 Explorer to graph and analyze the effects of nutria on marsh loss.
Curated OER
Mathematics in Bioengineering: Its Application for Today's Students
High schoolers explore the different fields of bioengineering. They will create and interpret graphs from cancel cells data. They then calculate the amount of drugs found in blood and eliminated by the body over time.
Teach Engineering
How Effective is Your Sunscreen?
Protect skin from UV radiation! Groups design and conduct an experiment to test the effectiveness of UV safety products. The groups collect the data from the experiment and prepare a lab report. In the second day of the activity,...
Curated OER
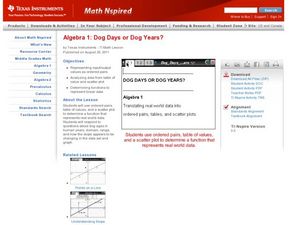
Dog Days or Dog Years?
In need of some algebraic fun with real world implications?Learners use ordered pairs, a table of values and a scatter plot to evaluate the validity of several real world data sets. The class focuses on dog ages in human years, domain,...
Curated OER
Shedding Light on the Weather with Relative Humidity
Learners study weather using a graphing calculator in this lesson plan. They collect data for temperature and relative humidity for every hour over a day from the newspaper, then place the data in their handheld calculator and examine it...
Curated OER
Environmental Issues in Multimedia Presentation
Students investigate a community environmental issue. They document it using traditional scientific methods, digital photography, and videotaping. After collecting data, they graph the results. Students present their findings in a...
Curated OER
Corn-Crop is a Bin-Buster
Learners calculate percent change and create lists of data. They enter the corresponding bushels of corn measured in billions to their list and display, then convert the acres into scientific notation and use the value on the home screen...
Curated OER
The Human Population
In this human population worksheet, students are given data about the size of the human population from the 1800s to 1999. They plot the data and answer critical thinking questions about the changes in human population.
Curated OER
Biodiversity and Ecosystems
Middle schoolers differentiate between biotic and abiotic factors in this science lesson plan. Learners collect data for the experiment and analyze the data after graphing it using the CBL 2. This experiment is split into two different...
Curated OER
Weather, Sea Level Rise and Climate Change
Eighth graders compare and contrast weather and climate. In this earth science lesson, 8th graders research weather data site and analyze historical data. They present their findings in class and explain identifiable trends.


