Curated OER
Sweethearts and Data Analysis
Learners explore the concept collecting and representing data. In this collecting and representing data lesson, students record the different colors of sweetheart candies in their sweethearts box. Learners create a table of the data and...
Curated OER
Canada at a Glance
Stjudents examine the statistics in a Canadian publication for use in graphs. They develop their own questions based on tables and graphs found in this publication..
Curated OER
Graphing the Facts
Students investigate the correlation between our planet's weather and solar activity. They analyze and discuss data regarding the solar activity cycle, graph annual precipitation and temperature averages over a period of 100 years, and...
Alabama Learning Exchange
Poppin' For Popcorn!
Students graph data from different popcorn flavors. In this graphing lesson, students make graphs using an assigned web site after collecting data about the flavors of popcorn that fellow classmates prefer.
Center of Excellence for Science and Mathematics Education
A Sick Astronaut
Aspiring astronauts graph, interpret, and analyze data. They investigate the relationship between two variables in a problem situation. Using both graphic and symbolic representations they will grasp the concept of line of best fit to...
Curated OER
Traveling Through the Solar System
Students use calculator and non-calculator methods for analyzing data. They apply data collection and analysis in a study of mass and weight. Students enhance and apply the concept of line of best fit. They master graphing in a plane,...
Curated OER
Water Resources
Students study water resources that are important to the people of North American and Africa. They use satellite images and data to explore how human actions can degrade, improve, or maintain water resources. They analyze and interpret...
Curated OER
What Influences Reaction Rate?
Learners study reaction rates, what determines how fast a reaction happens and how the chemical changes occur. In this reactions lesson students complete a lab where they use Alka-Seltzer to observe reaction rate and create a graph with...
Curated OER
Range, Mean, Median, Mode
Students research the impact of craters. In this range, mean, median and mode activity, students complete an experiment with a marble to simulate the effects of a crater. Students collect and analyze data finding the range, mean, median...
Curated OER
200 Years and Counting: How the U.S. Census Tracks Social Trends
Students examine the process of census taking in the United States. For this "200 Years and Counting" lesson, students examine the data collection process, look at an example of a census form, analyze data, and learn what the information...
Curated OER
Where's The Beef
Students create and conduct a survey in the community to evaluate the demographics of vegetarians in the community. They compile data, create graphs, calculate percentages, and draw conclusions about the survey data. Students create an...
Curated OER
3 Kinds of Graphs
Students construct three different graphs-a line graph, a bar graph, and a circle graph. In this graphing instructional activity, students use different graphs to display various data that they collect.
Curated OER
Nutrition and Food Security
Examine the three basic nutrients and their effects on the body. Fifth graders will research data to construct a bar graph and then demonstrate the relationship between malnutrition and food security. This is a very comprehensive...
Curated OER
Iron For Breakfast
Third graders are challenged to use scientific thinking, they experiment and observe which objects are attracted to a magnet. Pupils use the evidence to construct an explanation as to what common property the objects attracted to a...
University of Colorado
The Moons of Jupiter
Can you name the three planets with rings in our solar system? Everyone knows Saturn, many know Uranus, but most people are surprised to learn that Jupiter also has a ring. The third in a series of six teaches pupils what is around...
Virginia Department of Education
Analyzing and Interpreting Statistics
Use measures of variance to compare and analyze data sets. Pupils match histograms of data sets to their respective statistical measures. They then use calculated statistics to further analyze groups of data and use the results to make...
Science 4 Inquiry
At the Top: A Bald Eagle's Diet
Bald eagles are opportunistic predators and eat fish as well as raccoons and other mammals. Pupils learn about bald eagle diets through a simple simulation and videos. They collect and analyze data to understand the adaptability of this...
Curated OER
Stars and Slopes
More of a math lesson than physics or space science, high schoolers take a set of data and plot it on a log-log coordinate system. The write-up for day two was never completed, but day one, "Stars and Slopes," is complex and cohesive....
Chicago Botanic Garden
Historical Climate Cycles
Ice core samples give scientists access to climates of old—those from more than 800,000 years ago. Through an analysis of various temperature graphs from ice cores, tree rings, and weather stations, scholars compare historical climates...
Curated OER
Level III: Technology Integration
Fourth graders prepare two spreadsheets each with an embedded line graph that displays data about the growth of the bitter rot fungus on apples and on petri dishes that were stored in the refrigerator and the classroom. They prepare a...
Science 4 Inquiry
The Ups and Downs of Populations
Life has its ups and downs ... especially if you're an animal! Biology scholars engage in a population study through an inquiry-based instructional activity. Pupils work together to explore the factors that affect deer populations, then...
Curated OER
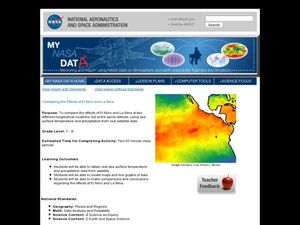
Comparing the Effects of El Nino and La Nina
Students examine the differences between an El Nino and La Nina year. For this investigative lesson students create maps and graphs of the data they obtained.
University of Georgia
Splat!
What does viscosity have to do with splatter? An activity shows that the viscosity of a substance is inversely proportional to the distance of its splatter. Learners conduct the experiment by collecting data, graphing, and analyzing the...
NOAA
Tracking a Drifter
Be shore to use this drifter resource. The third installment of a five-part series has learners using the NOAA's Adopt-a-Drifter website to track to movement of a drifter (buoy) in the ocean. Graphing the collected data on a map allows...


