Curated OER
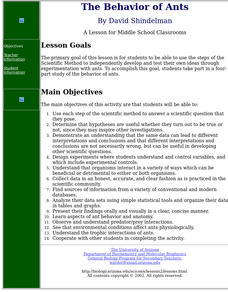
The Behavior of Ants
Students use the steps of the Scientific Method to develop and test their own ideas through experimentation with ants.
Curated OER
Designing An Investigation
Students will design a scientific investigation. In this engineering design instructional activity, students will set up an investigation, collect data and form a conclusion about bridge design. They will use common household items to...
Curated OER
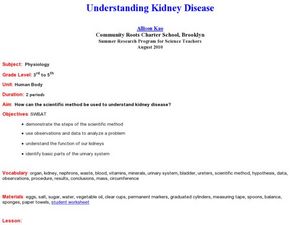
Understanding Kidney Disease
Learners experiment to determine information about kidney function. In this kidney function lesson, students use the scientific method to experiment with eggs, water, salt, sugar, and vegetable oil to simulate kidney function. They...
NASA
Determining the Nature, Size, and Age of the Universe
Prompt scholars to discover the expansion of the universe themselves. Using photographs of other galaxies, they measure and then graph the size and distance of each. Finally, they draw conclusions and prove the universe is expanding.
University of Colorado
Happy Landings: A Splash or a Splat?
Huygens spacecraft landed on Saturn's moon Titan in 2005, making it the farthest landing from Earth ever made by a spacecraft. In this hands-on activity, the 12th installment of 22, groups explore how density affects speed. To do this,...
PHET
Soda Bottle Magnetometer
Introduce learners to set of complete instructions that describe how to build a magnetometer that works just like the ones professional photographers use to predict auroras. The diagrams are wonderfully descriptive, and the written...
Curated OER
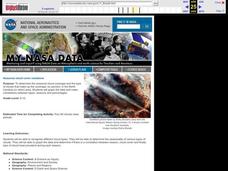
Seasons and Cloud Cover, Are They Related?
Students use NASA satellite data to see cloud cover over Africa. In this seasons lesson students access data and import it into Excel.
WK Kellogg Biological Station
Plotting Phenology
Finally, a worksheet that involves more than filling in some blanks. Your budding ecologists must graph and analyze three sets of data, then synthesize the information as they think about the impacts of plant reproduction on insects and...
Curated OER
MAISA and the REMC Association of Michigan
Students complete online research to study geography's impact on weather. In this geography and weather lesson, students research weather in their city for ten days using an online website. Students bookmark the site, enter data into a...
Curated OER
Zebra Mussel Population Simulation
Students are taught how to format and enter data into an Excel spreadsheet. They make a graph, and interpret graphed data. Students discuss the possible impacts of zebra mussels on the Hudson river. They graph zebra mussel data.
Curated OER
Human Fingerprints: No Two The Same
Learners will be offered numerous opportunities to further enhance their observational skills as well as the integration of math with their continual exposure to the metric system, measurement, and graphing to represent their data....
Curated OER
The Survey Says
Young scholars experience the development of statistical data. In groups, they construct a survey questionnaire for a target audience. Students produce the questionnaire, distribute it, collect it, and tabulate the data. Using EXCEL,...
Curated OER
Team Apollo
Seventh graders brainstorm about problems with a school track. They research different possibilities for a solution. They test different track materials with erosion, durability, abrasiveness and resiliency. They determine the area,...
Curated OER
The Greenhouse Effect
Seventh graders investigate the temperature change in open and closed containers. In this earth science instructional activity, 7th graders relate this lab activity to greenhouse effect. They create a line graph from data collected in...
Curated OER
Believe It...Or Not
Pupils critically analyze data regarding climate changes using a glossary of terms generated by examination of climate related articles. They examine and graph climatic data, and discuss, hypothesize and test apparent discrepancies in...
Curated OER
Seasonal Cloud Cover Variations
High schoolers recognize different cloud types. They determine the seaonality of various types of clouds. They graph the data and determine if a correlation exists between season, cloud cover and type of clouds most prevalent during each...
Curated OER
Laws of Motions
Seventh graders explore the Laws of Motion. They define friction and explain the concept of inertia. Students explain what happens when a force is exerted on an object that is in equilibrium. They state the second and third laws of motion.
Curated OER
Through Thick or Thin!!!
Students differentiate between high and low viscosity. Students collect, graph, and interpret data, then quantitatively measure polymer solids. Students experiment with a household example of an emulsion polymer.
Curated OER
Soggy Seeds
Students conduct experiments to learn about seed germination. In this seed germination lesson, students write a hypothesis for the seed experiment. students complete the experiment for seed germination and graph the data obtained from...
Curated OER
Using the Very, Very Simple Climate Model in the Classroom
Students study the relationship between the average global temperature and carbon dioxide emissions. In this weather lesson students develop a test scenario using a model then read and interpret graphs of data.
Curated OER
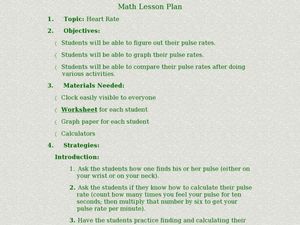
Graphing Heart Rates
Young scholars explore heart rates. They record pulse rates, predict which exercises cause a faster heart rate, make a chart, and graph the results. Students write an essay using the data to support their predictions. They write a...
Curated OER
Analysis of Atmospheric Conditions for a High Mountain Retreat
Students examine the relationship between altitude, atmospheric pressure, temperature and humidity at a particular location. They practice science and math in real world applications. They write reports detailing their scientific...
Curated OER
Collect Data Using a Transect Line
Middle schoolers learn about transect lines through a study of marine debris. In this marine debris lesson, students calculate the items on a transect line and graph them. Middle schoolers complete a category worksheet.
Curated OER
"Graphing Your Motion"
Students study the concepts of motion, velocity, and acceleration through graphing their own movement using LoggerPro. They explain the difference between speed and velocity using the weather vane example. They discover the difference...


