Curated OER
Graphing Linear Equations
Ninth graders review the information that they have already learned
with regard to linear equations and graphical representations. They then assist in combining equations with a graphical element and complete various graphs with this...
Curated OER
Spyglass
Students distinguish between visualization and scientific visualization. They use the software program Spygalss to create images from two-dimensional arrays of numbers.
Curated OER
Seed Growth
Students develop an independent procedure to investigate the germination of two types of seeds. Students must construct data tables or charts to record observations and results, graph the data, and analyze the data.
Curated OER
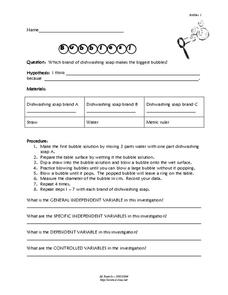
Bubbles
Young scholars experiment bubbles. In this scientific method lesson, students identify variables used in proper experiment design. Young scholars conduct experiments with different brands of dish-washing detergent to determine which...
Curated OER
Go The Distance Car Construction
Students build and program a car to drive a specific challenge distance.They must at the end of the instructional activity, have the car that stops the closest to a challenge distance.
Curated OER
Coral Bleaching in the Caribbean
Students practice analyzing images, maps and graphs from Internet-based educational resources. They explore the correlation between sea surface temperature and coral bleaching. Students comprehend that coral reefs are collections of tiny...
Texas State Energy Conservation Office
Investigation: Kinetic and Potential Energy
A well-developed lab sheet guides physical science learners through an investigation of kinetic and potential energy. In small groups, collaborators discover whether or not the ramp height or mass of an object has an effect on the...
Virginia Department of Education
Weathering of Limestone
We all know limestone weathers, but what affects the rate of weathering? Young scientists investigate the physical and chemical weathering of limestone (chalk) through experimentation. First, they conduct trials with different-size...
Curated OER
Death by Particles
Emerging epidemiologists define relative risk and read an article about the effect of particulate pollution on the cardiovascular health of women. They record the relative risk values, graph them, and answer analysis questions. This is a...
Curated OER
Re-Presenting Race in the Digital Age
Teen-aged scientists analyze a graphic organizer of how trash is removed from New York City and then answer standard questions about a graph and a diagram. Resources are mentioned, but there are no links to these resources, so you will...
Curated OER
ACT Science Reasoning Test
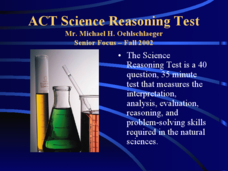
The types of scientific information that need to be analyzed in the ACT test are presented here. Tips and techniques for completing the research, data, viewpoints, and multiple choice questions will help your class and their expectations.
Curated OER
Scientific Method for Middle Schools
Students use the scientific method to solve a teacher scenario. They bring in M&M's. Students are given a copy of the scientific method. They first come up with a problem. Students are told that they are going to conduct an...
Curated OER
FLY HIGH!!!
Students create their own bird study in their own schoolyard using the scientific method (see Testing a Hypothesis in Join the Project). Students do research in the library, at a local college, or on the Internet to determine the...
Curated OER
Creeping
Young scholars observe, measure, and graph a model of slow down slope movement representing soil creep. This task assesses students' abilities to collect, record, and organize data, set up graph axes, plot data points, draw line graphs,...
Curated OER
Ocean Botttom Profile
Students interpret a graph of ocean depths and topographic features. This task assesses students' abilities to interpret figures, organize and represent data, apply knowledge of scale to a profile, and apply theoretical knowledge.
Curated OER
Heat Loss
Students comprehend how heat loss is affected by exposed surface area. They decide what type of and how many data to
collect. Students decide how the results should be presented. They make a series of accurate observations
Curated OER
Rate of Cooling Experiment
Ninth graders measure the insulation properties of different fabrics by immersing cans of water covered with fabric "socks" in an ice bath and measuring temperature changes. They then calculate heat loss and graph the data individually.
Curated OER
Energy/Light/Heat/Sound
Fourth graders study the properties of heat in this series of lessons. They discuss sources of heat and experiment to determine its properties. They identify insulators and conductors by measuring temperatures, and graphing their data....
Curated OER
Introduction to Graphical Representation of Data Sets in Connection with Nuclear Decay
Students record data, make observations, and share in experimentation and discussion of numerical experiments.
Curated OER
Climate Change
Students compare weather data and draw conclusions. In this climate change lesson plan, students determine whether data collected over a period of ninety years shows a warming trend.
Curated OER
The Bouncing Ball
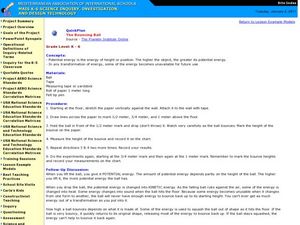
Students use the scientific method to conduct an experiment to test how a ball bounces. In this inquiry-based physical science and scientific method lesson, students drop a ball from specified heights and record the rebound, then record...
Curated OER
Pika Chew
Students work in collaborative teams with specific roles, use the Internet to research the behavior and ecology of pikas, make predictions about survival rates of pikas in different habitats and organize their data in graphs.
Curated OER
Gravity, Angles, and Measurement
Students relate math to real life scenarios. In this geometry lesson, students launch a ball tracking each launch using a graph. They analyze their data for speed, angles and distance, trying to improve on each launch.
Curated OER
How Do We Solve the Problem of Wildlife on Our Roads?
Students analyze data on elk ecology and movements across the highway. In this ecology lesson, students research ways to save them from highway collisions. They write a report and present their findings in class.


