Curated OER
Human Fingerprints: No Two The Same
Learners will be offered numerous opportunities to further enhance their observational skills as well as the integration of math with their continual exposure to the metric system, measurement, and graphing to represent their data....
Curated OER
The Survey Says
Young scholars experience the development of statistical data. In groups, they construct a survey questionnaire for a target audience. Students produce the questionnaire, distribute it, collect it, and tabulate the data. Using EXCEL,...
Curated OER
Team Apollo
Seventh graders brainstorm about problems with a school track. They research different possibilities for a solution. They test different track materials with erosion, durability, abrasiveness and resiliency. They determine the area,...
Curated OER
The Greenhouse Effect
Seventh graders investigate the temperature change in open and closed containers. In this earth science instructional activity, 7th graders relate this lab activity to greenhouse effect. They create a line graph from data collected in...
Curated OER
Believe It...Or Not
Pupils critically analyze data regarding climate changes using a glossary of terms generated by examination of climate related articles. They examine and graph climatic data, and discuss, hypothesize and test apparent discrepancies in...
Curated OER
Seasonal Cloud Cover Variations
High schoolers recognize different cloud types. They determine the seaonality of various types of clouds. They graph the data and determine if a correlation exists between season, cloud cover and type of clouds most prevalent during each...
Curated OER
Laws of Motions
Seventh graders explore the Laws of Motion. They define friction and explain the concept of inertia. Students explain what happens when a force is exerted on an object that is in equilibrium. They state the second and third laws of motion.
Curated OER
Through Thick or Thin!!!
Students differentiate between high and low viscosity. Students collect, graph, and interpret data, then quantitatively measure polymer solids. Students experiment with a household example of an emulsion polymer.
Curated OER
Soggy Seeds
Students conduct experiments to learn about seed germination. In this seed germination lesson, students write a hypothesis for the seed experiment. students complete the experiment for seed germination and graph the data obtained from...
Curated OER
Using the Very, Very Simple Climate Model in the Classroom
Students study the relationship between the average global temperature and carbon dioxide emissions. In this weather lesson students develop a test scenario using a model then read and interpret graphs of data.
Curated OER
Graphing Heart Rates
Young scholars explore heart rates. They record pulse rates, predict which exercises cause a faster heart rate, make a chart, and graph the results. Students write an essay using the data to support their predictions. They write a...
Curated OER
Analysis of Atmospheric Conditions for a High Mountain Retreat
Students examine the relationship between altitude, atmospheric pressure, temperature and humidity at a particular location. They practice science and math in real world applications. They write reports detailing their scientific...
Curated OER
Collect Data Using a Transect Line
Middle schoolers learn about transect lines through a study of marine debris. In this marine debris lesson, students calculate the items on a transect line and graph them. Middle schoolers complete a category worksheet.
Curated OER
"Graphing Your Motion"
Students study the concepts of motion, velocity, and acceleration through graphing their own movement using LoggerPro. They explain the difference between speed and velocity using the weather vane example. They discover the difference...
Curated OER
Graphing Linear Equations
Ninth graders review the information that they have already learned
with regard to linear equations and graphical representations. They then assist in combining equations with a graphical element and complete various graphs with this...
Curated OER
Spyglass
Students distinguish between visualization and scientific visualization. They use the software program Spygalss to create images from two-dimensional arrays of numbers.
Curated OER
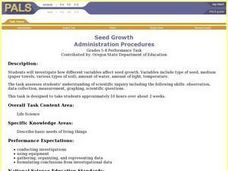
Seed Growth
Students develop an independent procedure to investigate the germination of two types of seeds. Students must construct data tables or charts to record observations and results, graph the data, and analyze the data.
Curated OER
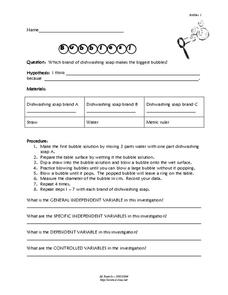
Bubbles
Young scholars experiment bubbles. In this scientific method lesson, students identify variables used in proper experiment design. Young scholars conduct experiments with different brands of dish-washing detergent to determine which...
Curated OER
Go The Distance Car Construction
Students build and program a car to drive a specific challenge distance.They must at the end of the instructional activity, have the car that stops the closest to a challenge distance.
Curated OER
Coral Bleaching in the Caribbean
Students practice analyzing images, maps and graphs from Internet-based educational resources. They explore the correlation between sea surface temperature and coral bleaching. Students comprehend that coral reefs are collections of tiny...
Virginia Department of Education
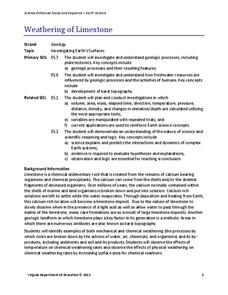
Weathering of Limestone
We all know limestone weathers, but what affects the rate of weathering? Young scientists investigate the physical and chemical weathering of limestone (chalk) through experimentation. First, they conduct trials with different-size...
Curated OER
Death by Particles
Emerging epidemiologists define relative risk and read an article about the effect of particulate pollution on the cardiovascular health of women. They record the relative risk values, graph them, and answer analysis questions. This is a...
Curated OER
Re-Presenting Race in the Digital Age
Teen-aged scientists analyze a graphic organizer of how trash is removed from New York City and then answer standard questions about a graph and a diagram. Resources are mentioned, but there are no links to these resources, so you will...
Curated OER
ACT Science Reasoning Test
The types of scientific information that need to be analyzed in the ACT test are presented here. Tips and techniques for completing the research, data, viewpoints, and multiple choice questions will help your class and their expectations.


