Curated OER
Functions and Their Graphs.
Students solve equations and label it as a function or not. For this algebra lesson, students make a table of values and graph their equation. They identify the domain and range of each graph.
Curated OER
The Kangaroo Conundrum: A Study of a Quadratic Function
Students play a game and collect data for their graph. In this algebra lesson, students solve quadratic equations and identify properties of their graph. They describe the pattern created by the graph and the game.
Curated OER
Jump and Graph
Third graders practice measuring skills by jumping and measuring the lengths with yardsticks. After measuring five jumps each, they draw bar graphs representing their jumps.
Curated OER
Archaeological Self-Study: What Do Our Belongings and Trash Tell About Us?
Students examine how their belongings and their trash represents who they are. In this archaeology skills lesson, students watch a video titled "Discovering the Past" and then give archaeological techniques a try. Students examine and...
Curated OER
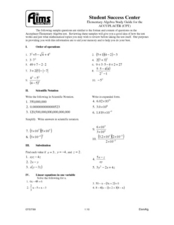
Elementary Algebra Study Guide
Middle and high schoolers solve problems involving linear equations, inequalities, quadratics, radicals, systems of equations, exponents, and polynomials. Many of the problems encompass a review of Algebra I. This 10-page worksheet...
Curated OER
Graphing Equations From Software
Students plot equations. In this graphing activity, groups of students play the "Green Globs" graphing game to practice previously learned graphing skills. However, the author does not include information about how to obtain the software...
Curated OER
Analyze This
Students gain practice in the analysis of various types of graphs common in daily life. These examples often use graphic images like charts, graphs, tables, and pictures to supplement learning.
Curated OER
Favorite Days
Students collect and organize data about themselves. In this data analysis lesson, students discuss their favorite calendar dates and explore ways to display the data.
Curated OER
What's My Pattern?
Students recognize, describe and extend patterns in three activities. They organize data, find patterns and describe the rule for the pattern as well as use the graphing calculator to graph the data to make and test predictions. In the...
Curated OER
Gummy Bear Math
First graders predict, collect data, and create a graph based on gummy bear colors they are given. In this graphing lesson plan, 1st graders first predict how many colors of gummy bears there are. They then count the colors, graph them,...
Curated OER
Storybook Character Graph
First graders dress as their favorite storybook character. They draw a self-portrait, then place the drawing on a graph.
Curated OER
Chart Your Course
Students explore change represented in graphs comparing distance and time. They exchange and share their graphs. Students interpret and create distance versus time line-graphs, and write stories based on these graphs. They interpret a...
Curated OER
M & M Madness
Students work with the mathematics unit of collection, organization, and presentation of data. In this math and technology lesson plan, students use Valentine M & M’s and The Graph Club to sort and graph the various colored M & M’s.
Curated OER
Functions and the Vertical Line Test
Students examine functions and function notation. They use computer activities to discover how to graph functions, and conduct a vertical line test. Students describe spatial relationships using coordinate geometry.
Curated OER
When is Your Birthday?
Students use data about their birthdays to create graphs. In this collecting and communicating information lesson, students make a class list of their birthdays. Students use the information to make a bar graph showing the information.
Curated OER
Data Analysis and Probability
Students make their own puzzle grid that illustrates the number of sit-ups students in a gym class did in one minute, then they make a histogram for this same data. Then they title their graph and label the scales and axes and graph the...
Curated OER
Raising the Bar While Hogging the Ham (Radio, That Is)
Young scholars watch a Cyberchase video to determine the importance of using the correct scale when making bar graphs. They examine how to use bar graphs to gain information easily. They determine how to use bar graphs persuasively.
Curated OER
Creating Circles
Learners make a circle graph. In this graphing lesson, the teacher conducts a class survey, then demonstrates how to make a pie graph. When students are comfortable with the material, they use a worksheet to create their own graph.
Curated OER
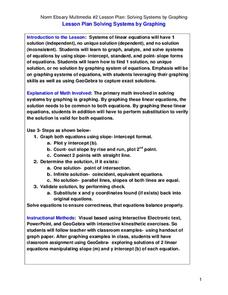
Solving Systems by Graphing
Students solve systems of equation through graphing. In this algebra instructional activity, students solve linear equations and analyze the result to figure out if there is one solution, no solution or infinitely many solutions. They...
Curated OER
What's Your Favorite Planet?
Fourth graders, after listing the nine planets and their differences, choose one planet as their favorite. From the information acquired on each students favorite planet, they make a graph illustrating their favorites and then transform...
Curated OER
Which Amusement Park Would You Choose?
Students analyze data related to amusement parks and create a spreadsheet to display the data. They read the data and predict which amusement park they think is safer, create a spreadsheet and graph, and write a proposal based on their...
Curated OER
Mean, Median, and Mode
Fourth graders compare two sets of data by using a double bar graph. For this data analysis lesson, 4th graders study a double bar graph and complete questions based upon the data. Students construct a table to show the data from the...
Curated OER
Eat Your Veggies
Students investigate displaying data. In this displaying data lesson, students use tallies to count data about food preferences. Students use various types of graphs such as bar graphs, picture graphs, box-and-whisker plots, etc to...
Curated OER
Graphic Accounts
Students identify the use of different types of bar graphs. They analyze graphs used in the New York Times to compare the estimated cost of the war in Iraq to other hypothetical expenditures and reflect on how graphs can help illustrate...
Other popular searches
- Graphing Skills Lesson Plans
- Basic Graphing Skills
- Organizing and Graphing Data
- Introducing Graphing Skills
- Graphing Skills Using M&ms
- Graphing Skills in Science
- Graphing Skills for Prek
- Graphing Skills With Fruits
- Graphing Skills in Chemistry
- Graphing Skills for Perk
- Graphing Skills Worksheet
- Reading Graphing Skills


