Curated OER
Give Me A Break!
Students create and conduct a survey. In this broken bones lesson, students discuss if they've ever broken a bone and how a broken bone heals. Students generate questions for a survey on broken bones and healing time, conduct the survey...
Curated OER
Probability Using M&M's
Students estimate and then count the number of each color of M&M's in their bag. In this mathematics lesson, students find the experimental probability of selecting each color from the bag. Students create pictographs and bar graphs...
Curated OER
Graphic Accounts
Students identify the use of different types of bar graphs. They analyze graphs used in the New York Times to compare the estimated cost of the war in Iraq to other hypothetical expenditures and reflect on how graphs can help illustrate...
Curated OER
Then and Now
Learners conduct research and use census data to compare different times and places. In this census lesson, students interpret data from charts and graphs, comparing census information from two time periods as well as from two different...
Curated OER
Take Another Look
Seventh graders analyze different types of graphs and answer questions related to each. In this math lesson, 7th graders organize a given diagram to make it easier to interpret. They discuss why they made such changes.
Curated OER
Numbers and Me
Students collect and graph data about themselves. In this collecting and graphing data lesson plan, students poll their classmates about how many siblings they have or they measure their height. Students make a bar graph of their data....
Curated OER
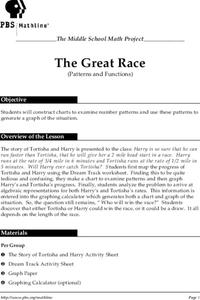
The Great Race
Young scholars are presented with a story about two individuals running a race in which one is given a head start. Students must map the progress of the runners, create a chart examining patterns and graph the progress. In the end,...
Curated OER
Pizza, Pizza
Learners survey community members to determine their favorite pizza toppings and create a bar graph to show their findings. In this probability and statistics lesson, students collect data by conducting a survey. They analyze the data,...
Curated OER
The Hudson's Ups and Downs
Fifth graders practice interpreting line graphs of the Hudson River water levels to assess the tides and tidal cycles in the estuary. They explore how weather can affect water levels and tides and observe that high tides and low tides...
Curated OER
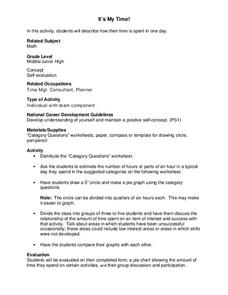
It's My Time!
Students create a pie chart. In this time lesson, students determine the amount of time they spend on given activities. They create a pie chart diagraming the data. Students share their graphs with the class.
Curated OER
Measuring Inches
First graders measure the length of pipe cleaners to form worms using rulers to focus on inches. They record their results and graph the measurement of each pipe cleaner. They measure their pipe cleaner "worms" in various colors and...
Curated OER
Computation: How can we use rice to solve problem questions?
Fourth graders graph metric tons of rice produced by various countries. In this graphing instructional activity, 4th graders follow problem solving steps to answer questions about rice nutrition and then graph the amount of rice...
Curated OER
Consumer Confusion: Wants versus Needs and Gandhi's Wisdom
Fourth graders create graphs to illustrate consumer consumption throughout the world. In this consumer lesson plan, 4th graders also discuss wants and needs around the world, and consider Gandhi's opinion on material possessions as they...
Curated OER
Is the Hudson River Too Salty to Drink?
Students explore reasons for varied salinity in bodies of water. In this geographical inquiry lesson, students use a variety of visual and written information including maps, data tables, and graphs, to form a hypothesis as to why the...
Curated OER
Explore Chapters 1 - 5
Students preview the novel, "Dragonwings," by Laurence Yep, make connections between the novel previewed and their prior knowledge, other texts, and the world. They utilize graphic representations including charts, graphs, pictures, and...
Curated OER
Trout Pond
Middle schoolers demonstrate the use of iteration, recursion and algebra to model and analyze a changing fish population. They use graphs, equations, tables, and technological tools to investigate the effect of varying parameters on the...
Curated OER
Earth Energy Budget Pre Lab
Learners explore energy by conducting an in class experiment. In this climate change lesson, students conduct a water vapor experiment in a soda bottle. Learners utilize graphs and charts to analyze the results of the experiment and help...
Curated OER
Responding to A Sound of Thunder by Writing PowerPoint Presentations
Students, after reading "A Sound of Thunder," create a PowerPoint presentation about time travel. They study and utilize a graphic organizer to assist them in preparing to deliver an oral presentation next and finally they print their...
Curated OER
Mapping the Transcontinental Journey
Students develop their geography skills. In this Lewis and Clark instructional activity, students collaborate to calculate the time and distance of different segments of the expedition. Students compare their estimate to Lewis and Clark's.
Curated OER
Get Ready, Get Set, Get Organized! Lesson 2 of 2
Seventh graders examine the importance of being organized when making transitions. In this organization lesson, 7th graders watch a teacher demonstration of entering a room in a disorganized manner before discussing how the transition...
Curated OER
Create A Park Map
Students design ultimate park experience for Florida families as they demonstrate their knowledge of map legend skills.
Curated OER
Mapping the News
Students explore cartography. In this map skills and map making lesson, Students work in groups to create wall size world maps including legends, compass roses, latitude and longitude, and physical features. Students collect current...
Curated OER
Hopes and Dreams: A Spreadsheet Lesson Using Excel
Fourth graders read "The Far Away Drawer" by Harriet Diller and discuss the story as a class. After discussion, 4th graders create a t-shirt GLYPH about their hopes and dreams,share their information with the class and create spreadsheets.
Curated OER
Speed + Graphing = Winners!
Fifth graders take addition timed tests every day for a two week period. Using the data from the timed tests, they create a bar graph using Microsoft Excel computer software, a personal bar graph using graph paper and colored pencils,...
Other popular searches
- Graphing Skills Lesson Plans
- Basic Graphing Skills
- Organizing and Graphing Data
- Introducing Graphing Skills
- Graphing Skills Using M&ms
- Graphing Skills in Science
- Graphing Skills for Prek
- Graphing Skills With Fruits
- Graphing Skills in Chemistry
- Graphing Skills for Perk
- Graphing Skills Worksheet
- Reading Graphing Skills


