Alabama Learning Exchange
We Love to Graph!
Learners experience graphing points. For this graphing points lesson, students play an on-line game where they must name 10 coordinate pairs correctly. Learners play a maze game where they maneuver a robot using coordinate pairs. ...
Curated OER
What's Your Favorite? Survey And Graphing Project
Sixth graders create and edit spreadsheet documents using all data types, formulas and functions, and chart information. They collect and organize data that be portrayed in a graph that they create using EXCEL.
Curated OER
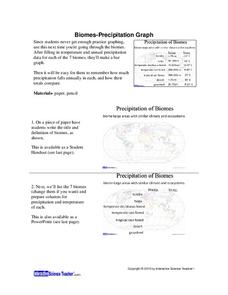
Biomes: Precipitation Graph
Students practice graphing by studying biomes. In this precipitation lesson plan, students graph the precipitation patterns for the 7 biomes on Earth. Students view a PowerPoint presentation in class which explores the 7 biomes and the...
Curated OER
Graphing Sunspot Cycles
Students explore sunspots and then graph them to analyze the data. In this sunspot cycles lesson students complete an activity sheet and complete questions.
Curated OER
An Interdisciplinary Deer and Human Population Study
Students answer the question, "What environmental problems arise due to animal and human overpopulation and what might need to be done to combat these problems?" They play games, graph data and write proposals about the question.
Curated OER
Graphing Population Around the World
Students define specific vocabulary necessary for understanding population data. They collect, analyze, and interpret specific data. They utilize computer programs in order to create graphs of collected data.
Curated OER
Making Circle Graphs
Seventh graders engage in the practice of a Math lesson. Students practice the use of circle graphs in class and on homework as an extension. The lesson includes a classroom management portion. The assignment for the lesson is for the...
Curated OER
Who's Coming to Lunch: A Study of Mold Growth
Students participate in an experiment to determine where fungi and molds are formed, and create graphs documenting fungal growth.
Curated OER
Marvelous Mathematics
Students make a table on the computer, but create fractions and equivalent fractions through the use of color. They are able to manipulate fractions in order to gain a greater understanding of the meaning of whole number that is broken...
Curated OER
Computer Graphing
Students research the Internet or create surveys to find graphable data. They collect, organize, analyze and interpret the data. Finally, they choose the appropriate type of graph to display the data and find the measures of central...
Curated OER
Computer Skills
Students research computer information and use it to find the mean of things. In this computer skills activity students are given activities in which they calculate and use a spreadsheet to enter data on the mean of their assignment.
Curated OER
My Favorite Birthday
Learners collect and organize data from classmates, display data on simple chart, and plan class birthday party.
Curated OER
Birth and Death Rates in European countries
Students discover the world as a global community and the social implications. They construct graphs to represent data, interpret diagrams and draw inferences.Students create a report, which could lead to a class discussion.
Curated OER
Confidence Levels
Learners collect data and graph it. In this statistics lesson, students rate confidence levels by collecting data and analyzing it. They graph their findings on the Ti calculator.
Curated OER
A Study of a Quadratic Function
Young scholars factor and solve quadratic equations. In this algebra lesson, students play a game as the collect and graph data. they identify properties of their parabola and make predictions.
Curated OER
Minimum and Maximum of a Graph
Students find the solutions of polynomials through graphing. In this algebra lesson, students identify the maximum and minimum of each polynomial function. They ind the vertex, domain and range of a parabola.
Curated OER
A Planet Full of Animals
Students study animals and practice classifying them through observation activities. In this animal classification lesson, students complete a KWL chart about animals. Students then sort pictures of animals into chart categories based on...
Curated OER
Recession Lesson: The Silver Lining of the Economic Downturn
Students discuss money and interest. For this discussing money and interest lesson, students discuss positives of an economic recession. Students discuss how savings rates have increased over time and the general attitude towards...
Curated OER
Help! I Need Five Minutes to Study
Students learn to use a time grid or a calendar to increase productivity of their studying. In this studying lesson, students record how they spend their studying time and then adjust as needed. Students recognize various ways to...
Curated OER
Literacy as a Force in the World
Students research and compare economic factors and data mining in Nepal. Students look at data to determine how the Nepalese quality of life compares to other countries and predict whether the literacy rate indicates or influences the...
Curated OER
Studying Special Segments in Triangles
Students investigate special segments in triangles. For this geometry lesson, students graph, compare, estimate and predict findings based on their data. They differentiate between similarity and congruence of triangles.
Curated OER
I'm in the Money - Practical Money Skills
Students make a budget and utilize math skills to keep a record of what they spend. They use technology and spreadsheets to help them keep track of their money.
Curated OER
Fun With Graphs
First graders read about making graphs and lean how to make graphs using "The Graph Club" software.
Curated OER
Graphing Favorite Colors
Third graders collect data and insert it into ClarisWorks to create a spreadsheet/graph of their favorite color. They interpret the data together.
Other popular searches
- Graphing Skills Lesson Plans
- Basic Graphing Skills
- Organizing and Graphing Data
- Introducing Graphing Skills
- Graphing Skills Using M&ms
- Graphing Skills in Science
- Graphing Skills for Prek
- Graphing Skills With Fruits
- Graphing Skills in Chemistry
- Graphing Skills for Perk
- Graphing Skills Worksheet
- Reading Graphing Skills


