Curated OER
3-D Beginning Graphs
Students explore the concept of big and small. They collect objects from the classroom, sort them by size, and create a graph using Duplo stacking blocks.
Curated OER
Graphing Ordered Pairs
In this math worksheet, students learn to graph ordered pairs. Students examine a graph with 3 labeled points and tell the ordered pairs for each. Students also plot 8 ordered pairs on a graph they draw themselves.
Curated OER
Creating a Bar Graph with a Graphing Program
Students use the S'COOL data base to create a bar graph.
Curated OER
Graphing Practice
Students study the ways to graph values. In this graphing lesson plan students read graphs and use a rubric to decide how well each is constructed
Curated OER
Graphing Data on Ellis Island
Third graders use data to make a bar graph. In this graphing and social studies lesson, 3rd graders use data about where Ellis Island immigrants came from to complete a bar graph on Microsoft Excel.
Curated OER
Graphing Heart Rates
Young scholars explore heart rates. They record pulse rates, predict which exercises cause a faster heart rate, make a chart, and graph the results. Students write an essay using the data to support their predictions. They write a...
Curated OER
Graphing Integers On a Coordinate Plane
Seventh graders explore the concept of graphing integers on a coordinate plane. In this graphing integers on a coordinate plane instructional activity, 7th graders discuss scenarios where coordinate systems are used in real life. ...
Curated OER
Studying Fossils
Students hypothesize dinosaur size and speed by looking at dinosaur track way or by measuring a dinosaur models water displacement. In addition, techniques to help students become familiar with the ways paleontologists study fossils can...
Curated OER
Skills You Need to Succeed
Students identify basic skills needed to succeed in the world of work, including communication skills, computation skills, problem solving skills, and interpersonal skills.
EngageNY
Another Computational Model of Solving a Linear System
The process of elimination really works! Use elimination when substitution isn't doing the job. The 29th segment in a series of 33 introduces the elimination method to solving linear systems. Pupils work several exercises to grasp the...
EngageNY
Characteristics of Parallel Lines
Systems of parallel lines have no solution. Pupils work examples to discover that lines with the same slope and different y-intercepts are parallel. The 27th segment of 33 uses this discovery to develop a proof, and the class determines...
Bowland
Mystery Tours – Plan Your Tour
Everyone loves a vacation and a set of three activities has groups planning a tour of the U.K. using given distance, time, and price data. They solve a variety of problems related to the trip and produce a report on the success of the trip.
Science 4 Inquiry
Snakes in the Everglades
The Burmese python is on the loose ... and he's hungry! Illustrate the differences between causative and correlative relationships through an inquiry instructional activity. Pupils examine several sources of information to determine if...
National Research Center for Career and Technical Education
Depreciation (Double Declining)
Have you ever been told that your new car begins to lose its value as soon as you drive it off the lot? Aspiring accountants take on the concepts of depreciation and book value through an easy-to-deliver career and technology lesson. The...
West Contra Costa Unified School District
Solving a System by Substitution
Solving systems by substitution can be a challenging topic in algebra I. Here is a activity that builds on students' understanding of intercepts to begin the process of substitution, and all work is reinforced graphically to build...
NOAA
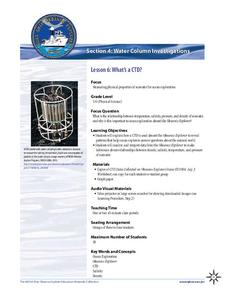
What's a CTD?
Why are the properties of the water important when exploring the ocean? Young scientists discover the tools and technology used in deep sea exploration in the fourth installment in a five-part series. Groups work together to examine...
PBS
Data Plots of Exoplanet Orbital Properties
Scientists discovered the first exoplanet in 1995 and by early 2018, they confirmed the existence of more than 3,700—that's a lot of data! As part of the PBS 9-12 Space series, scholars interpret data about exoplanets. They compare...
Teach Engineering
The Challenge Question
A research position becomes a modeling job. The introductory activity in a series of nine presents the challenge of analyzing a set of bivariate data. The class brainstorms what the data may represent. Pupils must decide what is needed...
Missouri Department of Elementary
What Are Bullying and Harassment? Part 2
After reviewing notes from the previous lessons, small groups obtain a scenario card that describes a situation in which bullying is happening. Peers discuss the event and brainstorm two solutions using the STAR method then present their...
Missouri Department of Elementary
Dealing with Peer Influence: What Are Bullying and Harassment?
Scholars examine examples of peer pressure and discuss how specific actions negatively affect one's well-being. Learners gather in small groups to write two scenarios in which peer pressure is used. They reference the STAR method in how...
Curated OER
Nicotine addiction and youths
Students read CNNfyi article: "Nicotine addiction can begin in days, study says," and have class discussion about the effects of nicotine on the human body.
Chicago Teachers Union Quest Center
Factored Form of a Quadratic Function
Build upon linear functions to learn about quadratics. The lesson introduces the concept of zeros for quadratic functions and makes the connection to the linear factors of the function. It presents quadratics in both graphical and...
EngageNY
Conversion Between Celsius and Fahrenheit
Develop a formula based upon numerical computations. The 31st part of a 33-part unit has the class determine the formula to convert a temperature in Celsius to a temperature in Fahrenheit. They do this by making comparisons between the...
Curated OER
If Our Class Went to See the Prince
First graders read the story One Monday Morning and create picture graphs based on the number of teachers, boys, and girls that would visit the prince. In this data lesson plan, 1st graders interpret tables and graphs with the help of...
Other popular searches
- Graphing Skills Lesson Plans
- Basic Graphing Skills
- Organizing and Graphing Data
- Introducing Graphing Skills
- Graphing Skills Using M&ms
- Graphing Skills in Science
- Graphing Skills for Prek
- Graphing Skills With Fruits
- Graphing Skills in Chemistry
- Graphing Skills for Perk
- Graphing Skills Worksheet
- Reading Graphing Skills


