Curated OER
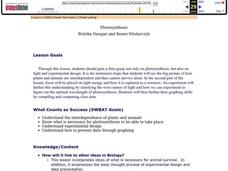
Photosynthesis
Students recognize the importance of plants as they perform an experiment involving photosynthesis. Students determine the optimum wavelength of light for photosynthesis by exposing plants to different colors of light, collecting data,...
Mathematics Assessment Project
Mean, Median, Mode, and Range
What a find! Here is a lesson, designed to meet sixth grade math Common Core standards, that focuses on the calculation of different measures of center for the scores from a penalty shoot-out competition. An independent...
University of Georgia
Energy Content of Foods
Why do athletes load up on carbohydrates the evening before a competition? The lesson helps answer this question as it relates the type of food to the amount of energy it contains. After a discussion, scholars perform an experiment to...
Sri Atmananda Memorial School
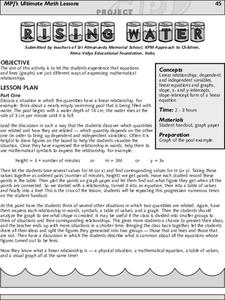
Rising Water
An engaging, and not to mention attractive, lesson plan has prealgebra and beginning algebra scholars examining linear relationships. They consider the rising water level as a swimming pool is being filled. They do so by charting and...
Curated OER
Sums and Difference of Cubes
Learners factor polynomials using the sum and difference of cubes. They also learn connections between the graph and expression.
Curated OER
Graphing Favorite Fruit
Third graders take poll and sort data, enter the data to create a spreadsheet and create bar and pie graphs.
Curated OER
Esperanza Rising - Anticipation Guide
Learn about Mexican culture while simultaneously strengthening reading, writing and computer skills. In order to get the most out of Esperanza Rising, pupils should have prior knowledge of Mexican culture. Therefore, there are links to a...
Center Science Education
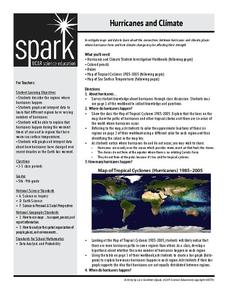
Hurricanes and Climate
Feeling under the weather? This lesson on hurricanes can whip things up! With professionally designed maps and handouts, teach your future weathermen (or women) where, when, and how hurricanes occur. They identify hurricane regions and...
National Wildlife Federation
The Tide is High, but I’m Holding On… Using ICESat Data to Investigate Sea Level Rise
Based on the rate of melting observed from 2003-2007 in Greenland, it would take less than 10 minutes to fill the Dallas Cowboys' Stadium. The 17th activity in a series of 21 has scholars use the ICESat data to understand the ice mass...
Curated OER
Reading the Neighborhood
First graders complete activities with the story One Monday Morning in the Macmillan/McGraw Hill Textbook. In this data lesson, 1st graders read the story and gather data to create a picture graph. They read the graph and answer...
Curated OER
How Do You Like Your Eggs?
First graders conduct a poll about how people like their eggs. In this graphing lesson plan, 1st graders collect data about how they like their eggs. Students use a picture of themselves to place under the type of egg they like. Students...
Curated OER
Exploring Linear Equations And Scatter Plots - Chapter 5 Review
Young scholars complete rolling stocks experiment, and collect and enter data on the computer. They enter data on graphing calculators, complete scatter plot by hand with line of best fit, and discuss different graphing methods.
Curated OER
Sorting Sweethearts
Young scholars categorize sweetheart candy by color or message. In this sorting and graphing instructional activity, students collect data by sorting the candy and then diagram their results in a graph.
Curated OER
Line 'Em Up!
Students find coordinate points on a grid and create a line graph with those points. This lesson should ideally be used during a unit on various types of graphs. They make and use coordinate systems to specify locations and to describe...
Curated OER
Glass Transition in a Rubber Ball
Learners illustrate the changes in the properties of a material at its glass transition point. They gather data which they use to construct graphs regarding elastic modules versus absorption modulus, tangent delta, and the effect of...
Curated OER
Lab 2: Drag Racing
In this activity, students, Analyze the relationship between velocity and acceleration * Calculate an object's average acceleration * Collect data and interpret it* Create and analyze a graph showing acceleration.Students also work in...
Curated OER
Solar Kit Lesson # 12 - Calibration Curve for a Radiation Meter
Scientists need to have mastered algebraic slope-intercept concepts in order for this lesson to be effective. They will measure and graph solar panel output as a function of the amount of radiation striking it, discovering that there is...
Utah Education Network (UEN)
Insides and Outsides
Give small groups handfuls of unit cubes and then dare them to build as many rectangular prisms as possible using only 12 cubes. This engaging activity serves as an introduction to the volume of solid figures. In addition to volume,...
Curated OER
Riding on a Pendulum
A comprehensive resource gets fourth grade physical scientists making observations about the period of a pendulum and then applying knowledge to a playground swing. Through seven different stations, they will record observations and...
Chicago Botanic Garden
Micro-GEEBITT Climate Activity
A truly hands-on and inquiry based learning activity bridges all the lessons in the series together. Beginning with a discussion on average global temperatures, young meteorologists use real-world data to analyze climate trends in order...
Science 4 Inquiry
States and Phases of Matter
Plasma is the most common phase of matter in our universe. Scholars explore the change of energy as molecules change phases of matter. They rotate through stations, graphing the changes in energy level.
Curated OER
Baseball Relationships - Using Scatter Plots
Young scholars use graphing calculators to create scatter plots of given baseball data. They also determine percentages and ratios, slope, y-intercepts, etc. all using baseball data and statistics.
Curated OER
Data Display
Students explore different ways to display data. In this statistics lesson plan, students create pie charts, bar graphs and line graphs to show data. Students then write a paragraph discussing which types of graphs are helpful for...
Curated OER
In A Heartbeat
Students discuss scatter plots then create a class scatter plot using their heart rate at rest and their heart rate after a few minutes of aerobic exercises. Students copy the points plotted as a class and create individual graphs...
Other popular searches
- Graphing Skills Lesson Plans
- Basic Graphing Skills
- Organizing and Graphing Data
- Introducing Graphing Skills
- Graphing Skills Using M&ms
- Graphing Skills in Science
- Graphing Skills for Prek
- Graphing Skills With Fruits
- Graphing Skills in Chemistry
- Graphing Skills for Perk
- Graphing Skills Worksheet
- Reading Graphing Skills


