Curated OER
"Eggs-ploring" Math with Jellybeans
Learners work in pairs with a small bag of jellybeans to estimate the number of candies in their bags and then figure out how many groups of 10 jellybeans are contained in their bags. They then graph the information using a pictograph or...
Curated OER
How Long Can You Go?
Eighth graders examine the usefulness of a line of best fit by collecting and graphing data, using a graphing calculator to determine the line of best fit, and making a variety of predictions. They watch a video, then design a...
Curated OER
The Very Hungry Caterpillar
Read the story, The Very Hungry Caterpillar, and complete activities from multiple subjects. Make a mural, create a class graph, discuss the life cycle of a butterfly, research information about butterflies on the Internet and make...
Illustrative Mathematics
Velocity vs. Distance
At the end of this activity, your number crunchers will have a better understanding as to how to describe graphs of velocity versus time and distance versus time. It is easy for learners to misinterpret graphs of velocity, so have them...
Curated OER
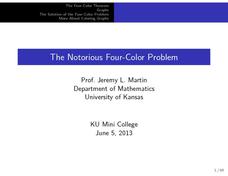
The Notorious Four-Color Problem
Take a walk through time, 1852 to 2005, following the mathematical history, development, and solution of the Four-Color Theorem. Learners take on the role of cartographers to study a United States map that is to be...
Kenan Fellows
Density
Most scholars associate density with floating, but how do scientists determine the exact density of an unknown liquid? The third lesson in a seven-part series challenges scholars to find the mass and volume of two unknown liquids. Each...
Curated OER
TE Activity: A Tornado in My State?
Students study data about tornadoes in the United States while completing a worksheet. They develop a bar graph showing the number of tornadoes for the top ten states in the US. They find the median and mode of the data set.
Curated OER
The Viewing Tube
Looking for an excellent instructional activity that incorporates math, science, and technology? Groups of three learners use a viewing tube to perform an experiment, and discover how to organize their data into an Excel...
Curated OER
Do new kinds of insects appear after soil modification?
High schoolers explore and experiment with the concept do new kinds of insects appear after soil modification. They assess and review scientific methods of observation, predicting, variables, math skills, ratio, proportions, graphs and...
Mathematics Assessment Project
Representing Polynomials
Use this complete and very detailed lesson plan to assess your students' understanding of two important behaviors of polynomials. The first is the relationship between the zeros of a polynomial function and the function's graph, and the...
Curated OER
Historical Population Changes in the US
High schoolers conduct research on historical population changes in the U.S. They conduct Internet research on the Historical Census Data Browser, create a bar graph and data table using a spreadsheet program, and display and interpret...
Curated OER
Algebraic Thinking - Equations
Fifth graders explore equality and inequality by participating in a Tilt/Balance activity. The students listen to the story "Lemonade for Sale" by Stuart J. Murphy and use equations to graph lemonade sale profits.
Curated OER
Mathematics Module
Delve into graphing! The concepts covered begin with basic graphing basic coordinates and algebraic expressions on coordinate planes, and build up to graphing linear inequalities and equations. Learners solve and simplify various...
02 x 02 Worksheets
Inverse Variation
Discover an inverse variation pattern. A simple lesson plan design allows learners to explore a nonlinear pattern. Scholars analyze a distance, speed, and time relationship through tables and graphs. Eventually, they write an equation to...
Curated OER
Pizza! Pizza!
Third graders tally, sort, and organize pizza orders from monthly school sales. They create an advertising campaign to promote the School Pizza Sale, record the data in graph form, compare and contrast the tallies throughout the year,...
Curated OER
How Toxic Is It?
Students participate in an activity in which they investigate the scientific method and seed germination as well as practice graphing and metric measuring skills. Students examine toxicity by exposing Wisconsin Fast Plants seeds to toxic...
Curated OER
The Parachute
Students discuss parachutes and write a procedure to determine the effect of different size parachutes and different masses on the time it takes the masses to fall. They record all their data from their experiment then write three...
Curated OER
Using Your Marbles - Volume Measurement and Reporting
Demonstrate how to measure the volume of liquids and solids immersed in liquid to your class. They observe a teacher-led demonstration, and in small groups construct a data table that demonstrates how many marbles were used and the...
Curated OER
Volume, Mass, and Weight
Study the difference between mass and weight. Your math group will compare the weight of an item to the amount of space that it uses. They'll then use conversion factors to find the difference between kilograms and pounds. Essential...
Curated OER
Exponential Functions
Analyze functions by their shape and equation and identify decay and growth based on the equation given. Learners graph their exponential functions and differentiate it using the logarithmic versus the exponential function.
ARKive
Handling Data: African Animal Maths
Handling and processing data is a big part of what real scientists do. Provide a way for your learners to explore graphs and data related to the animals that live on the African savannah. They begin their analysis by discussing what they...
EngageNY
Modeling a Context from a Verbal Description (part 2)
I got a different answer, are they both correct? While working through modeling problems interpreting graphs, the question of precision is brought into the discussion. Problems are presented in which a precise answer is needed and...
Virginia Department of Education
Rational Equations
Provide guidance and practice of the useful skill: solving rational equations using both an algebraic and graphical approach. Pupils solve increasingly more difficult rational equations using algebraic methods. After, they...
EngageNY
Properties of Trigonometric Functions
Given a value of one trigonometric function, it is easy to determine others. Learners use the periodicity of trigonometric functions to develop properties. After studying the graphs of sine, cosine, and tangent, the lesson connects...
Other popular searches
- Graphing Skills Lesson Plans
- Basic Graphing Skills
- Organizing and Graphing Data
- Introducing Graphing Skills
- Graphing Skills Using M&ms
- Graphing Skills in Science
- Graphing Skills for Prek
- Graphing Skills With Fruits
- Graphing Skills in Chemistry
- Graphing Skills for Perk
- Graphing Skills Worksheet
- Reading Graphing Skills


