EngageNY
Graphing Cubic, Square Root, and Cube Root Functions
Is there a relationship between powers and roots? Here is a activity that asks individuals to examine the graphical relationship. Pupils create a table of values and then graph a square root and quadratic equation. They repeat the...
Curated OER
Graphs of the Heart
Students study Greek literature. In this Greek tragedies lesson, students explore the dance-dramas of Martha Graham. Students study the choreography that brings ancient Greek literature to life.
Curated OER
Digestion & Nutrition: a Case Study
Students explore digestion/nutrition and utilize scientific investigation skills. They complete meal logs for several days and graph their results. After analyzing their data, they write formal lab reports.
Curated OER
Data Squares
Middle and high schoolers examine how data squares organize and sort information and data sets. They discuss examples of data squares, complete a data square about themselves, organize the data squares for the class together, and compile...
Curated OER
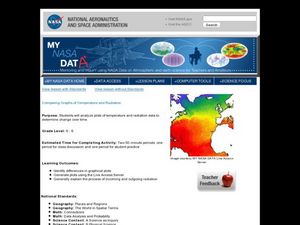
Comparing Graphs of Temperature and Radiation
Middle schoolers study plots and use a Live Access Server to generate plots. In this temperature lesson students examine the process of incoming and outgoing radiation.
Curated OER
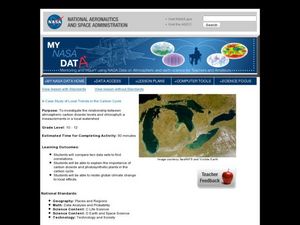
Case Study of Local Trends in the Carbon Cycle
Students examine the relationship between chlorophyll and carbon dioxide in the atmosphere. In this investigative lesson plan students study the local effects of climate change.
University of Florida
A Walk in the Woods
Take class members on a field trip to the forest without leaving the classroom. Scholars learn content-related vocabulary and factors affecting forest health with class discussions and during a presentation. Scientists combine forestry...
Virginia Department of Education
Transformation Investigation
Graph it! Investigate transformations with a graphing calculator. Pupils graph sets of linear functions on the same set of axes. They determine how changes in the equation of a linear function result in changes in the graph.
Missouri Department of Elementary
Respect for Self and Others—Giving and Getting the Big R
Tween find out what it means to give and get respect. After reviewing the Recipe for Relationships studied in a previous lesson plan, groups create a dramatization of two-minute scenario in which an individual behaves inappropriately in...
Curated OER
How Many More on a Graph?
First graders examine data on a graph and determine which variable on the graph has more. They draw pictures of their family members and determine which families have more members than other families. Using squares of paper to depict...
Curated OER
Graphing
Fifth graders practice using math graphs. In this graphing instructional activity, 5th graders work in groups to develop a topic of their own to represent as a graph. Students collect data and construct a graph for the instructional...
Curated OER
Activity Plan 4-5: I'm Graphing to Know You!
Students create graphs about themselves to learn more about one another. For this early childhood math lesson, students record information about one another as they make picture graphs.
US Environmental Protection Agency
Carbon Through the Seasons
Meteorologists view an animated video by the Environmental Protection Agency to learn how the carbon cycle works, and then move into groups to analyze and graph actual data of the atmospheric carbon dioxide concentration from Hawaii's...
Curated OER
Great Graphing
Students collect data, use a computer spreadsheet program to create various graphs, and compare the graphs. They state the findings of each graph in writing and decide which graph type best represents the data.
Curated OER
Graphing Using Excel
Fifth graders complete a series of graphs by gathering information and using Excel to graph the information. In this graphing lesson plan, 5th graders graph favorite desserts of the class. Student put their results into the computer and...
Texas Instruments
Data Collection for Bar Graphs
Learners study the concept of central tendency in this data collection for bar graph lesson. They collect data outside as instructed and organize it into a bar graphs, then they list in specific groups the labels that appear on the...
Curated OER
Charts and Graphs
Fifth graders interpret data into graphs and percentages. In this organizing data lesson, 5th graders discuss bar, circle and line graphs. Students complete bar graph and apply probability using the results.
Curated OER
Graph It with Coffee!
Young scholars interview employers and employees at local coffee shops about sales and profits and create graphs comparing and contrasting information obtained about the businesses.
Curated OER
A Reading Graph
Students construct and interpret a "favorite classroom books" graph. In this literacy and math graphing lesson, students choose a reduced size copy of the book cover that corresponds with the book(s) they chose to read during their...
Curated OER
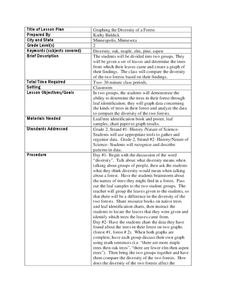
Graphing the Diversity of a Forest
Second graders work in groups to identify what types of trees create which types of leaves In this plant life lesson plan, 2nd graders analyze a set of leaves and identify the tree it came from while graphing the data in a science...
Curated OER
Graphing Pasta
Students sort and graph various types of pasta. Using pasta construction paper patterns or real pasta, they sort the pasta by color, size, and type, and record the data on a graph.
Curated OER
Build a Skittles Graph
Students construct a bar graph with a given set of data. They calculate the ratio and percent of the data. Students discuss alternate ways of graphing the data as well as multiple strategies to approach the task.
Curated OER
Polar Graphs
Students graph polar graphs. In this calculus lesson, students convert between polar and rectangular coordinates. They graph their solution on the TI calculator and make observations.
Curated OER
Data! Data! Graph that Data!
Fifth graders create data graphs using Microsoft Excel. In this data collection instructional activity, 5th graders create and conduct a survey, then use Excel to organize and graph their data.
Other popular searches
- Graphing Skills Lesson Plans
- Basic Graphing Skills
- Organizing and Graphing Data
- Introducing Graphing Skills
- Graphing Skills Using M&ms
- Graphing Skills in Science
- Graphing Skills for Prek
- Graphing Skills With Fruits
- Graphing Skills in Chemistry
- Graphing Skills for Perk
- Graphing Skills Worksheet
- Reading Graphing Skills


