Curated OER
Create a Graph Online
Scholars create colorful bar, line, or pie graphs. They decide on a survey question to ask or a type of data to gather. From there, they collect information and data. They display this data in bar, line, or pie graphs that they create...
Curated OER
Graphing Difference
Students use problem solving skills to reason, predict and problem solve through exploration. They recognize a way in which they are different from their peers and create a graph that shows these differences.
August House
Why Koala Has a Stumpy Tail
Learn about the animals of Australia with a language arts instructional activity about an Australian folktale called, Why Koala Has a Stumpy Tail. After reading the story as a class, kids discuss events and characters from the book,...
Curated OER
Literacy Activity: The Perfect Pet
Young scholars develop their listening skills as they listen to the book The Perfect Pet. In this reading instructional activity, students listen to the book, and then talk about the pets they have. Then they make a graph as a class of...
Curated OER
Activity Plan 4-5: I'm Graphing to Know You!
Students create graphs about themselves to learn more about one another. In this early childhood math lesson, students record information about one another as they make picture graphs.
Curated OER
A Reading Graph
Young scholars construct and interpret a "favorite classroom books" graph. In this literacy and math graphing lesson, students choose a reduced size copy of the book cover that corresponds with the book(s) they chose to read during their...
Curated OER
Making Graphs
Students explore statistics by conducting class demographic surveys. In this graph making lesson, students identify the family members of each classmate, pets they own, and favorite activities. Students organize their statistics and...
Lied Center of Kansas
The Ugly Duckling and The Tortoise and the Hare
Both The Ugly Duckling and The Tortoise and the Hare are great additions to an elementary language arts lesson. Young readers focus on the literary elements of each story, including characters and plot development, and apply counting and...
Curated OER
Bear Graphing
In this math worksheet, students count how many cinnamon bears and how many chocolate bears are in a heart. Students organize the information in a graph.
Curated OER
ABC...Have Fun With Me!
Throw out those old ABC worksheets and try some new and engaging hands-on activities to teaching the alphabet!
School Sparks
Christmas Worksheets for Santa's Little Helpers
Just because children aren't in the classroom over winter break, doesn't mean that learning has to stop. Intended as a resource for parents, this eBook provides Christmas-themed worksheets and activities that engage children in...
Haiku Deck
Haiku Deck - Beautiful Presentations and Slideshows with Charts and Graphs
Create beautiful and simple presentations, sales pitches, lessons, and visual stories that utilize Getty Images, high quality photos licensed under Creative Commons, as well as your own prints. What you create will demand people’s...
Curated OER
Creating Bar Graphs
Students create bar graphs based on the names in their family. In this bar graphs lesson, students collect the names of the their family members, graph the names into a graphing computer program, and compare the data with their classmates.
Curated OER
Summer Body Activity: As Big as Me!
Students explore things that are their size, literally. In this early childhood lesson plan, students use their bodies for measuring and comparing sizes as they work in pairs to complete the activity.
Curated OER
Halloween Count and Color #3
Practice counting to 3 and 4 with this Halloween-themed worksheet. You class will count and color different characters, then graph them in the provided chart. Note: An answer key is included.
Curated OER
Tracking Olympic Gold!
Students use print or online resources to track the results of the Olympic Games, record daily results on graphs, use graphs to collect information.
Curated OER
Be a Good Friend
Students discover characteristics of a good friend. In this social skills lesson, students read Clifford's Manners and discuss ways Clifford used his manners in the story. An activity that rewards students for modeling being courteous...
Curated OER
Jelly Bean Count
Students study graphs. In this mathematics lesson, students count and make a graph use jelly beans by sorting the jelly beans into colors. Students write the amount of each color under the color written on the graph paper and color that...
T. Smith Publishing
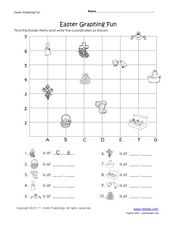
Easter Graphing Worksheet
A large graph takes up most of this worksheet. On it are Easter-themed icons for which learners must identify and write down the coordinates for. Note that there are religious symbols included in the icons which would not make this...
Curated OER
A Planet Full of Animals
Young scholars study animals and practice classifying them through observation activities. In this animal classification lesson, students complete a KWL chart about animals. Young scholars then sort pictures of animals into chart...
DLTK
Groundhog Paper Craft
Get crafty this Groundhog's Day with a hands-on activity that combines creativity and making predictions. Scholars color, cut out, and put together a friendly image of a groundhog and showcase whether they feel the weather will be sunny...
Curated OER
Studying Soils on South Penquite Farm
Young scholars investigate soil depth. In this studying soils instructional activity, students visit South Penquite Farm and collect samples. Young scholars record their data and graph results.
Curated OER
Practice Estimating!
Bring math home with this interative estimating worksheet! Scholars make educated guesses about the number of six household items: crayons in a crayon box, keys on a key ring, coins in a piggy bank, trees in the yard, pictures on the...
Iowa State University
A Model of Learning Objectives (Revision of Bloom's Taxonomy)
What would a three-dimensional representation of Bloom's revised taxonomy of the cognitive domain look like? Get a glimpse of the complex classification system that is frequently referenced in education to distinguish levels of learning.


