NASA
Connecting Models and Critical Questions
Scholars use data to analyze and determine which sets of information need to be counted. They create a model to explain differences among chemical elements using graphs to prove concept mastery.
Curated OER
Conductivity of salt Solutions
Students investigate the concentration level of solutions. In this math/science lesson, students identify three different ionic compounds. They predict the conductivity of each using their collected data.
Curated OER
LD50 of NaCl to Gammarus spp.
High schoolers learn the meaning of LD50 through lecture and discussion. Through experiment, students graph and calculate the LD50 of salt on fresh water amphipods. High schoolers compare results of the experiment with pesticides and...
Curated OER
Investigating Properties of Water: Temperature
Investigate how temperature affects the density of water and stratification that occurs in bodies of water when temperatures vary. Water of differing temperatures is given different colors to see the layers that form. The lesson is meant...
Curated OER
Graphing and Analysis of Water Quality Reports
Students practice making graphs and interpreting them. They compare and contrast different sets of data. They use Microsoft Excel to create different types of graphs.
Curated OER
Determination of the percentage of Acetic Acid in Vinegar
Learners determine the concentration of acetic acid when the concentration of the base with which is titrated is known. They investigate how to weigh a sample using the balance, measure volumes using graduated cylinder, explore the...
Curated OER
Stream Flow in Blacks Creek
Young scholars explore what factors affect the stream flow in a local body of water. They collect data to measure stream flow and discharge and construct a hypothesis concerning the factors affecting stream flow.
Curated OER
Fertilizers, Pesticides and Human Health
Students define several vocabulary terms related to chemicals and toxicology. Students calculate chemical concentrations in water and explain the toxicological principles that govern safety of substances. Students conduct an...
Curated OER
The Reaction Between Magnesium and Hydrochloric Acid
In this rate of chemical reactions worksheet, students experiment with different concentrations and volumes of hydrochloric acid mixed with magnesium. They measure the rates of the reactions and analyze their results from a graph they...
Curated OER
A Simple Thermoetric Titration
In this thermometric titration learning exercise, students investigate the changes in temperature when an alkali is neutralized by an acid. Students graph their results from the titration and draw 2 best fit lines on their graph. Where...
Curated OER
Paint Property Experiments
Students identify various kinds of paints by using the scientific method. In this solvents instructional activity students collect data and identify paint samples while working in teams.
Curated OER
Cool Liquids
Chemistry neophytes use a temperature probe to assess the change as five different liquids evaporate. The implantation section suggests that they take readings every five seconds for a total of four minutes. They graph the data, look up...
Curated OER
Giving and Taking Directions
Learners write set of written directions from their craft area in either chart or paragraph form, and give the directions orally to a third party who will listen to the directions and complete the task.
Curated OER
Blast Off
In this physical science exploration, small groups place a piece of antacid tablet into a film canister and step back to time how long it takes for the top to pop. They repeat the activity, altering either the amount or temperature of...
Curated OER
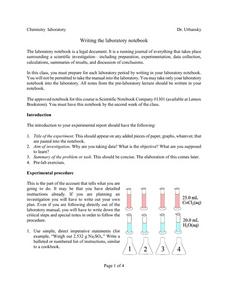
Writing The Laboratory Notebook
In this chemistry worksheet, students examine the given concept in order to apply in the laboratory setting. The sheet includes in depth background information.
Curated OER
The Perils of Drinking Water
Students determine the presence of drugs in water. In this chemistry lesson, students experiment on water samples using thin layer and column chromatography. They determine the concentration of drugs present using graphical analysis.
Curated OER
Ozone and Temperature Data Analysis, South Pole Antarctica
Learners discuss the layers of the atmosphere, and the history of the ozone hole. They discuss the chemistry of the ozone formation. Students compare seasonal data collected with ozonesondes. They compare Antarctic and Arctic ozone hole...
Curated OER
Science: Adding Solutes to Solvents
Young scholars design experiments examining the effects of various solutes on water. They record results on graphs explaining any unexpected consequences of their experiments and determine if their hypotheses were correct.
Curated OER
Teaching the Scientific Method Using Adhesives
Learners research on the history of adhesives. In this science lesson, students select one test to use in finding the stickiness of adhesives. They collect data and formulate a conclusion.
Oregon State
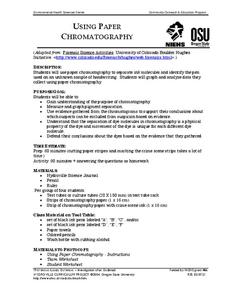
Using Paper Chromatography
Through the analysis of paper chromatography to separate ink from the pen found at the crime scene, learners analyze the different stains and through calculations determine the thief.
Curated OER
Heat Transfer and Pollution
Students perform computer simulations on air dispersion. In this chemistry lesson plan, students calculate energy transfer based on specific heat and temperature change. They explain the causes of smog.
Curated OER
Melting and Freezing of Water
Students differentiate the three states of matter. In this chemistry lesson, students analyze graphs of heating and cooling curve of water. They complete a lab report and discuss results.
Curated OER
Flame Test
Students conduct a flame test on different substances. In this chemistry lesson, students predict the element present based on the color emitted during the flame test. They explain how different elements produce different colors.
Curated OER
Motion: Speed, Velocity, Acceleration and Networking
Students interpret a variety of motion graphs. In this physics lesson, students calculate the speed and acceleration of objects using numerical data from graphs. They apply what they have learned to solve real world problems.


