Curated OER
Graphing Practice
Students study the ways to graph values. In this graphing lesson plan students read graphs and use a rubric to decide how well each is constructed
Curated OER
Fishy Frequencies
Tenth graders demonstrate that natural selection is an agent of evolution. They quantitatively apply the Hardy-Weinberg Principle to an imaginary population of fish. They utilize math and graphing skills, collecting and analyzing data,...
Curated OER
Foodborne Illness Outbreak Investigation
Students demonstrate how epidemiological investigations of outbreaks are performed. They illustrate the principles of hypothesis formation and testing by epidemiologic study in the setting of an acute foodborne disease outbreak.
Curated OER
Positive Futures Fair - Application of Year-Long Content Skills
Students demonstrate the knowledge of proper scientific investigation and reporting skills. They decide how to make a positive difference in the world using these skills.
Curated OER
Graph It
Elementary and middle schoolers engage in a lesson of graphing in quadrant I of the coordinate plain. They use the graph to create shapes and symbols. While using a graphing calculator, they locate the points on the coordinate plane. In...
Curated OER
Is Portland, Oregon Experiencing Global Warming?
Students use data to determine if the climate in Portland has changed over the years. In this weather lesson students complete line graphs and study long wave radiation.
Curated OER
We're Off To the Races!
Second graders use a magnet to "race" objects from one side of a racing track to another. They predict what the results are, then run the race. Pupils sort and graph which items were successfully moved, they attempt to race again. This...
Curated OER
The Parachute
Students discuss parachutes and write a procedure to determine the effect of different size parachutes and different masses on the time it takes the masses to fall. They record all their data from their experiment then write three...
Curated OER
How Does Your Blue Bonnet Grow?
Young scholars explore the conditions needed to grow Texas Blue Bonnets. In this Blue Bonnet planting lesson, students recognize the differences in Texas Blue Bonnet. Young scholars record their findings in a graphs and analyze their...
Curated OER
What's The Big Deal About Accutane?
Students take on the role of epidemiologists. They investigate an "outbreak" in serious birth defects that occur in infants born to teenage girls. students discover a link between the use of the acne drug called Accutane and birth defects.
University of California
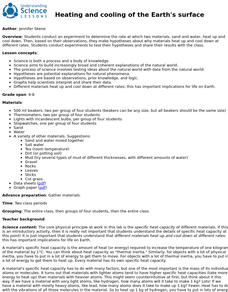
Heating and Cooling of the Earth's Surface
Scholars collect data from heating sand and water before forming testable hypotheses about why sand heats up faster. Afterward, they develop and run experiments to test their hypotheses.
Curated OER
Waves
Light waves and sound waves are the focus of this science lesson designed for 5th graders. Besides discovering how these waves travel, learners also discover the basic properties of waves, and analyze data tables and graphs. The...
Curated OER
The Effect of Math Anxiety on Cardiovascular Homeostasis
Using a pulse monitor, learners will measure a resting pulse, take a math test, and then measure the pulse again. They analyze the change in pulse and compare it to performance on the test. This multi-purpose lesson can be used in a...
National Center for Case Study Teaching in Science
Identical Twins, Identical Fates?
Can different personal experiences affect our genes? Find out in an intriguing case study about one twin who is diagnosed with mental illness and her identical twin who fears she may suffer the same fate. Designed for college-level...
Curated OER
Appearances Are Deceiving
Young scientists study creeks around their area to see how clean the water really is. One way to tell is by the invertebrate populations that are present. This lesson introduces a game which learners simulate a variety of species found...
Nuffield Foundation
Intrepreting Information about Sweating and Temperature
Why do we sweat? Scholars analyze data about body temperature, sweating, and other factors to better understand sweating. They note the changes after drinking ice water to sweating, skin temperature, and body temperature. Analysis...
Curated OER
Take Another Look
Seventh graders analyze different types of graphs and answer questions related to each. In this math lesson, 7th graders organize a given diagram to make it easier to interpret. They discuss why they made such changes.
Curated OER
Rain On
Fourth graders study the water cycle and clouds. In this water cycle and cloud lesson, 4th graders determine the definition of condensation and watch a demonstration in which the teacher makes a cloud in a bottle. They discuss the water...
Curated OER
Earth Energy Budget Pre Lab
Learners explore energy by conducting an in class experiment. In this climate change lesson, students conduct a water vapor experiment in a soda bottle. Learners utilize graphs and charts to analyze the results of the experiment and help...
Curated OER
Particulate Matter
Seventh graders examine the different types of pollutants. In this environmental science lesson, 7th graders observe particulate matter under a microscope. They explain how these can affect once health when breathed in large quantities...
Curated OER
Exploring an Atlas
Students explore global geography by participating in an atlas activity. In this countries of the world lesson plan, students collaborate in small groups and analyze an atlas while researching continents, countries and demographics....
National Security Agency
Are You Ready to Call the Guinness Book of Records?
Learners design questions that can be answered by collecting data. In this line-plot lesson, pupils collect data and graph on a line plot on world records. An abundant supply of teacher support is provided in this resource.
Curated OER
Scatter-Brained
Seventh graders graph ordered pairs on a coordinate plane. They create a scatterplot. Additionally, they determine the line of best fit and investigate the slope of the line. Multiple resources are provided. An excellent resource!
Curated OER
Graphing Your Motion
Seventh graders investigate velocity and speed. In this Vernier Probe instructional activity, 7th graders will use probes to calculate motion, speed, and velocity of an object. They will create a graph of their collected data.


