Curated OER
Glass Transition in a Rubber Ball
Students illustrate the changes in the properties of a material at its glass transition point. They gather data which they use to construct graphs regarding elastic modules versus absorption modulus, tangent delta, and the effect of...
Curated OER
Air Pollution in Mexico City
A fantastic lesson on urban air pollution problems throughout the world is here for you. Learners understand that there are many factors involved in creating pollution, that there are many health effects brought on by air pollution, and...
Physics Classroom
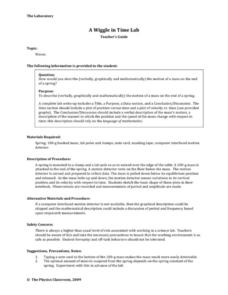
A Wiggle in Time Lab
Though an alternative method is suggested, the best way to carry out this investigation is with the use of a computer-interfaced motion detector. Physics fanatics hang a mass on the end of a spring and analyze its motion verbally,...
Chicago Botanic Garden
Plant Phenology Data Analysis
Beginning in 1851, Thoreau recorded the dates of the first spring blooms in Concord, and this data is helping scientists analyze climate change! The culminating instructional activity in the series of four has pupils graph and analyze...
Polar Trec
How Much Data is Enough?
The next time you read a magazine or watch the news, make note of how many graphs you see because they are everywhere! Here, scholars collect, enter, and graph data using computers. The graphs are then analyzed to aid in discussion of...
NOAA
A Matter of Density
Larvae transportation on the New England seamounts is based on the density of the water. Scholars calculate density and graph salinity versus temperature to better understand the distribution of organisms in a water column....
Baylor College
Living Things and Their Needs: The Math Link
Enrich your study of living things with these cross-curricular math activities. Following along with the story Tillena Lou's Day in the Sun, learners will practice addition and subtraction, learn how to measure volume and length,...
Virginia Department of Education
Laboratory Safety and Skills
Avoiding lab safety rules will not give you super powers. The lesson opens with a demonstration of not following safety rules. Then, young chemists practice their lab safety while finding the mass of each item in a mixture and trying to...
NOAA
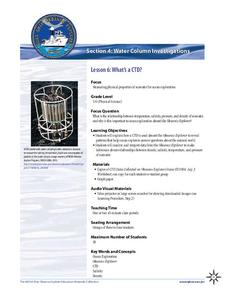
What's a CTD?
Why are the properties of the water important when exploring the ocean? Young scientists discover the tools and technology used in deep sea exploration in the fourth installment in a five-part series. Groups work together to...
Curated OER
What's in a Graph?
Learners explore how to use and interpret graphs. The graphs are pulled from a variety of sources, and the activities ask students to interpret graphs. They start this lesson with knowledge of what a graph is. Learners also know how to...
Teach Engineering
Complex Networks and Graphs
Show your class how engineers use graphs to understand large and complex systems. The resource provides the beginnings of graph theory by introducing the class to set theory, graphs, and degree distributions of a graph.
Curated OER
Fish Communities in the Hudson
Learning to read data tables is an important skill. Use this resource for your third, fourth, or fifth graders. Learners will will study tables of fish collection data to draw conclusions. The data is based on fish environments in the...
Curated OER
Go Fish!
So much science in one tiny fish! Introduce young biologists to the zebrafish, a common aquarium inhabitant. The small, unassuming organism presents an opportunity for learners to study habituation using an easy-to-care-for species. Lab...
Polar Trec
Foraging for Fish in a Melting Arctic
How much do you know about the black guillemot of the Arctic region? With great background information, images, and a quick discussion, the class will learn all about the plight of the foraging seabird as they play a fun game. First,...
National Geographic
Altitude: What's in the Air?
Introuduce your scientists to the differences in air at varying altitudes with a colorful explanatory graph. After some discussion, they view unbelievable footage of mountain-climbing Leo Houlding and a narrative about how he might do...
Curated OER
Ornithology and Real World Science
Double click that mouse because you just found an amazing lesson! This cross-curricular Ornithology lesson incorporates literature, writing, reading informational text, data collection, scientific inquiry, Internet research, art, and...
US Environmental Protection Agency
Carbon Through the Seasons
Meteorologists view an animated video by the Environmental Protection Agency to learn how the carbon cycle works, and then move into groups to analyze and graph actual data of the atmospheric carbon dioxide concentration from Hawaii's...
National Wildlife Federation
The Tide is High, but I’m Holding On… Using ICESat Data to Investigate Sea Level Rise
Based on the rate of melting observed from 2003-2007 in Greenland, it would take less than 10 minutes to fill the Dallas Cowboys' Stadium. The 17th instructional activity in a series of 21 has scholars use the ICESat data to understand...
National Wildlife Federation
I’ve Got the POWER! Solar Energy Potential at Your School
Should every school have solar panels? The 19th lesson in a series of 21 has scholars research the feasibility of using solar panels at their school. They begin by gathering data on the solar energy in the area before estimating the...
National Wildlife Federation
Wherefore Art Thou, Albedo?
In the sixth lesson plan in a series of 21, scholars use NASA data to graph and interpret albedo seasonally and over the course of multiple years. This allows learners to compare albedo trends to changes in sea ice with connections to...
Institute of Electrical and Electronics Engineers
Coloring Discrete Structures
What's the least number of colors needed to color a U.S. map? The lesson begins by having pupils view a video clip on continuous and discrete phenomenon, then launches into an activity reminiscent of Zeno's paradox. A separate video...
Curated OER
Investigating Seasonal Variability in NO2 Concentrations
Students study different formats of data and determine the nitrogen dioxide concentrations. In this seasons instructional activity students understand the different relationships that NO2 can have.
Curated OER
Keeping Your Heart in Good Shape: What are the Benefits? - Biology Teaching Thesis
Middle schoolers name the main parts of the heart and what events occur there. They write a reaction that contains complete sentences, and uses proper spelling and grammar, after viewing a video. Students define the following terms:...
Space Awareness
The Thermal Layers of Oceans
How much does the sun heat up a lake or ocean? Scholars use a cup and a strong lamp to investigate the heat transfer and thermal layers in the ocean to come up with the answer. They collect data and graph it in order to better understand...


