Curated OER
Pendulums
First-time physicists experiment with pendulums in this physics lesson. They vary the weight of the bob, record how long each takes to complete ten period swings, and then calculate the time for one period. They repeat the procedure,...
Curated OER
Theobroma - Food of the Gods
Students discuss the history of cacao and its use in the production of chocolate. They analyze actual cacao pods and record their observations. Finally they create a five minute contour drawing of the cacao pod and seeds.
Curated OER
Tsunami Simulation Experiment
Pupils examine an article about tsunami warning systems and discuss why they are important. They conduct an experiment that shows how the velocity of a wave in water changes with the depth.
Curated OER
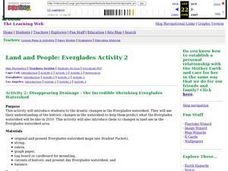
Activity 2: Disappearing Drainage - the Incredible Shrinking Everglades Watershed
Students examine drastic changes in Florida Everglades watershed, compare and contrast two watershed maps, discuss effects of addition of agriculture, loss of wetlands, and introduction of Water Conservation Areas, and predict condition...
Curated OER
Annual Wetland Plant Diversity Survey
Learners locate an area of marsh and, by measuring the total number of individual plants in a sample area, determine whether purple loosestrife population density is correlated to the total plant diversity of the community. They...
Curated OER
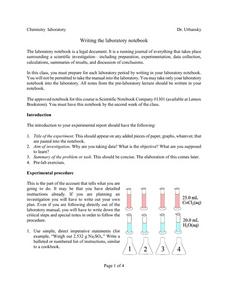
Writing The Laboratory Notebook
In this chemistry worksheet, learners examine the given concept in order to apply in the laboratory setting. The sheet includes in depth background information.
Curated OER
Upwelling - Cold One Day, Warm Another?
Discuss with your oceanographers what forces cause nearshore upwelling and downwelling. Display a line of wind vectors alongside a graph of the temperatures so that they can discover whether or not they are related. Discussion questions...
Curated OER
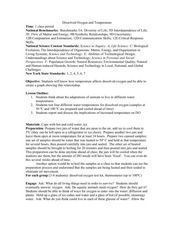
Dissolved Oxygen and Temperature
Young scholars are shown how temperature affects dissolved oxygen and they create a graph showing this relationship. They think about the adaptations of animals to live in different water temperatures. Students test four different water...
Curated OER
Blast the Fats
Students examine the fats found in foods. In this nutrition lesson, students identify the types and amounts of fats found in foods as they research food labels and the Internet. Students classify the fats and record their data.
Curated OER
Creeping
Young scholars observe, measure, and graph a model of slow down slope movement representing soil creep. This task assesses students' abilities to collect, record, and organize data, set up graph axes, plot data points, draw line graphs,...
Curated OER
Building a Pill Bug Palace
Students make "pets" of isopods (potato bugs) to determine their preferred environment and food sources. They record their results on a bar graph and in a scientific report.
Curated OER
CSI Clamshell Investigation
Pupils explore and explain how moon snails eat and where the holes in clamshells come from and then draw conclusion from the data collected. They incorporate math and graphing skills to determine if there is a relationship to a clam's...
Curated OER
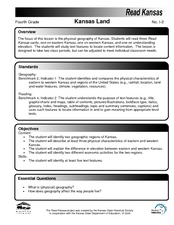
Kansas Land
Fourth graders discover the geographic regions of Kansas. In this geography instructional activity, 4th graders explore the different regions of Kansas and determine how the different geography affects daily life in Kansas.
Curated OER
A Plop and Fizz
Seventh graders perform an experiment to determine the effect of temperature on reaction rates. In this chemistry lesson, 7th graders take measurements and record data. They create a graph and analyze results.
Curated OER
Use It or Lose It
Students explore the effects of resistance training on the muscles. Data on the muscle mass of rats is examined is graphed to determine any increase in mass due to training.
Curated OER
You’re Tugging at Me!
Students study the sliding and rolling friction. In this forces instructional activity students divide into groups and use a cart to examine the amount of force that is used to move objects.
Curated OER
Exploring Alternative Energy Sources
Students research the amount and kinds of energy that are produced and consumed in the United States, including the limitations of this kind of consumption. They research and create a display to teach classmates about a specific...
Curated OER
It's In The Chocolate Chips
Students investigate which brand of chocolate chip cookies contains the most chocolate. They analyze and compare data using Microsoft Word and Microsoft Excel. They communicate the results with Microsoft PowerPoint.
Curated OER
Illuminating Climate Change: Connecting Lighting and Global Warming
Students analyze energy usage and connect energy usage to fossil fuel consumption. In this global warming and pollution lesson, students what fuels are used to generate electricity and how much CO2 each fuel produces, then graph the...
Curated OER
The Living Environment
Students use a spoon, clothespin, scissors, and toothpicks to simulate how animals get food in their environment. In this environment lesson plan, students learn about the adaptations animals make in order to survive.
Curated OER
Tsunami Simulation Experiment
Learners examine the importance of tsunami warning systems. They read and discuss an article, conduct an experiment in a wave tank, calculate wave velocities of tsunamis, and identify what happens to tsunamis as they approach a shoreline.
Curated OER
Show Me!
Students analyze and interpret graphs. In this graphing lesson, students view a video and construct their own graphs (line, circle, bar) from given sets of data.
Curated OER
The Blizzard of 1993
Students read and interpret the information from a barograph from a major winter storm. This task assesses students' abilities to interpret and analyze graphs, construct data tables and graphs, generalize, infer, apply knowledge of...
Curated OER
Rubber Band
Eighth graders investigate what would happen to the length of a rubber band as more and more rings were hung on it. They base their explanation on what they observed, and as they develop cognitive skills, they should be able to...


