Curated OER
Human Activity and the Environment
Students review and analyze graphs and tables as a group. They develop their graph and data analysis skills by converting data tables from Human Activity and the Environment into graphs.
Curated OER
Learning to Make Data Tables
Students construct data tables using the results of previous experiments. In this graphing lesson, students plot data and interpret the results. Students discuss how they organized their data.
Curated OER
Radioactive Decay
Students generate a radioactive decay table for an imaginary element, use their data to plot a decay graph, develop the concept of half-life, and use the graph to "age" several samples.
Curated OER
Bounce Back Ball
Fifth graders work in teams of four to measure the rebound heights of a tennis ball dropped from four different heights. They investigate with the bouncing balls to measure changes in the type of energy they possess.
Curated OER
Pumpkin Pumpkin
Students study the very basics of pumpkins. By looking at where pumpkins grow, what they grow on, and what can be done with a pumpkin. They create a graphic organizer and then carve a pumpkin for Halloween.
Science 4 Inquiry
At the Top: A Bald Eagle's Diet
Bald eagles are opportunistic predators and eat fish as well as raccoons and other mammals. Pupils learn about bald eagle diets through a simple simulation and videos. They collect and analyze data to understand the adaptability of this...
Wild BC
Greenhouse Gas Line-Up
Discuss different sources of energy and how much greenhouse gas each might emit. The six sources are then ranked according to emissions from greatest to least. Finally, the true cumulative emissions are revealed to show the class how...
Prince William Network
Migration Headache
During this game, kids become migratory shorebirds and fly among wintering, nesting, and stopover habitats. If they do not arrive at a suitable habitat on time, they do not survive. Catastrophic events are periodically introduced that...
PHET
Soda Bottle Magnetometer
Introduce learners to set of complete instructions that describe how to build a magnetometer that works just like the ones professional photographers use to predict auroras. The diagrams are wonderfully descriptive, and the written...
Cornell University
Sound Off!
Time to witness the effects of sound. Learners analyze different materials to determine their abilities to absorb sound waves. They use free software to monitor the amplitude of the waves to verify results.
Cornell University
Beam Focusing Using Lenses
Explore optics using an inquiry-based experimental approach! Young scholars use a set of materials to design and build a unit capable of focusing a beam of light. They experiment with different lenses to determine the best approach to...
Space Awareness
Water is a Heat Sink
One of the key objectives of Europe's Copernicus Earth program is to monitor the temperatures of the oceans and seas on Earth. Young scholars learn the effects of different heat capacities through two experiments. These experiments...
Curated OER
How High Are the Clouds?
Learners analyze height and collect data to create a graph. In this statistics lesson, students use central tendencies to analyze their data and make predictions. They apply concept of statistics to other areas of academics to make a...
Curated OER
Bar and Histograms (What Would You Use: Part 1)
Young scholars practice creating bar graphs using a given set of data. Using the same data, they create a group frequency chart and histograms. They must decide the best graph for the given set of data. They share their graphs with...
Curated OER
Bird Feeding and Migration Observation
Students research bird migration and build a bird house. In this bird lesson plan, students research the birds in their area and where they migrate to. They also build their own bird house and record data on what kinds of birds come to...
Alabama Learning Exchange
What's Your Favorite Chocolate Bar?
Learners complete a math survey. In this math graphs lesson, students complete a survey about their favorite candy bars. Learners create different kinds of graphs using Microsoft Excel to show their results.
Curated OER
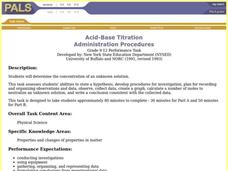
Acid-Base Titration
Students determine the concentration of an unknown solution. This task assesses students' abilities to state hypothesis, develop procedures for investigation, plan for recording and organizing observations and data, collect data, create...
Curated OER
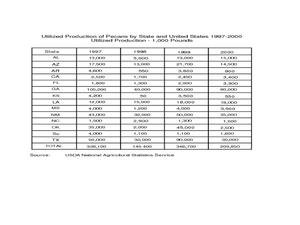
Pecan Power
Young scholars study the origins of pecans and complete a bar graph from the data they have discovered. In this pecan lesson plan, students draw pecans, discuss a pecan time line, and draw a bar graph comparing Arizona pecans to other...
Curated OER
Means of Growth
Students collect and graph data. For this statistics lesson, students analyze their plotted data using a scatter plot. They identify lines as having positive, negative or no correlation.
Curated OER
The Lake Effect
Fourth graders conduct an experiment demonstrating the effects of water and air temperature on precipitation. They create graphs demonstrating their findings using Claris Works for Kids.
Curated OER
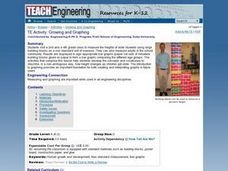
Growing and Graphing
Students visit a 2nd and a 4th grade class to measure the heights of older students using large building blocks as a non-standard unit of measure. They can also measure adults in the school community. Results are displayed in...
Curated OER
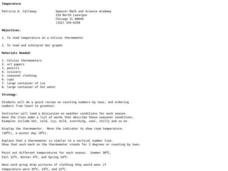
Temperature
Learners explore the concept of temperature. In this temperature lesson, students read thermometers in degrees Celsius. Learners discuss the temperature of the seasons and what clothing they might wear given a certain temperature....
Curated OER
Snow Cover By Latitude
Students create graphs comparing the amount of snow cover along selected latitudes using data sets from a NASA website. They create a spreadsheet and a bar graph on the computer, and analyze the data.
Curated OER
Insects: Grasshoppers
Students examine grasshoppers as they practice following instructions. In this biology lesson plan, students identify the characteristics of grasshoppers and the functions of grasshoppers' external body parts.


