Curated OER
I Think, Therefore I See
Students participate in a memory experiment to discover how the eye works. After reading an article, they analyze a new technique which examines how the brain registers sight. They develop their own memory game and conduct trials using...
Curated OER
Roads & Plant Diversity
Students, in groups, collect and analyze samples of native grassland plants near and around a road to show how roads have an impact on surrounding habitat.
Curated OER
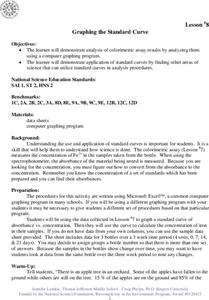
Graphing the Standard Curve
Srudents demonstrate analysis of colorimetric assay results by analyzing them using a computer graphing program and demonstrate application of standard curves by finding other areas of science that can utilize standard curves in analysis...
Curated OER
Driving Forces Forestry In Canada
Students discuss the natural and economic impact of forests and forestry. Using given statistics they construct different types of graphs in which they make observations and draw conclusions.
Curated OER
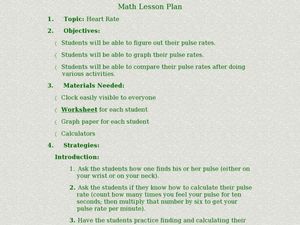
Graphing Heart Rates
Young scholars explore heart rates. They record pulse rates, predict which exercises cause a faster heart rate, make a chart, and graph the results. Students write an essay using the data to support their predictions. They write a...
Curated OER
Testing for Vitamin C in different drinks and foods
Students develop an awareness of the use of Vitamin C in helping our environment and gain exposure to chemical procedures and techniques. Students analyze and interpret data by keeping a data sheet and making a bar graph.
Curated OER
Math and Science in a Wetland
Students describe safe practice when doing field and lab investigations in a estuary or wetland. They create a model of an estuary and describe their value and function. They participate in field study in which they collect and analyze...
Curated OER
Food in History
Students research, predict and offer solutions regarding factors that affect current or future food crops could result in economic, political or social changes.
Curated OER
Studying Shadows
Young scholars measure shadows and explore the altitude of the sun. In this sun lesson students will graph the length of shadows and solar altitude against time.
Curated OER
Is There a Doctor in the House
Sixth graders predict outcomes of research. They analyze data and construct a class graph, then work cooperatively in a small group setting. They explain the prevention aspect of medicine, document references, and continue ongoing...
The New York Times
Fiction or Nonfiction? Considering the Common Core's Emphasis on Informational Text
Nothing aids in comprehension more than an explanation and understanding of why things are done. Address why the Common Core requires the reading percentages that it established and analyze how this affects your readers. Learners read...
Curated OER
Connecting With Coordinates
Play a coordinates game to encourage collaborative learning and grid use! Learners plot points on grids and play a game that challenges them to locate a specific point on a coordinate grid by using horizontal and vertical movements.
Curated OER
Latitude
Young scholars examine the theory of finding latitude and discuss the uses of an astrolabe, cross-staff and octant. They determine an Astronomical Table for their classroom.
Curated OER
Weather Graphs
First graders use their knowledge of weather symbols to organize and construct a graph of the daily weather for one month. Each student have a chance to give the daily weather report using Sammy's Science House Computer Software.
Curated OER
Functions in Motion
Students graph polynomials functions and analyze the end behavior. In this algebra activity, student differentiate between the different polynomials based on the exponents. They use a TI to help with the graphing.
Curated OER
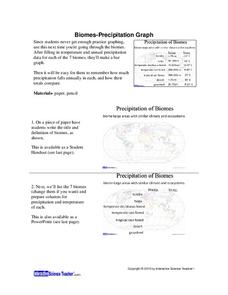
Biomes: Precipitation Graph
Students practice graphing by studying biomes. In this precipitation lesson plan, students graph the precipitation patterns for the 7 biomes on Earth. Students view a PowerPoint presentation in class which explores the 7 biomes and the...
Curated OER
World Population Study
Learners explore an exponential relationship and how it relates to human population growth and the current global population crisis. They graph both exponential and linear information.
Curated OER
Graphing Made Easy
Fourth graders discover the appropriate way to construct and analyze bar, line, picto, and circle graphs. They set up frequency tables and perform some statistical analysis (mean, median, and mode) on their data.
Curated OER
Water in the Texas Coastal Basins
Students, after researching a Texas coastal basin, map and graph the information they collect and then translate it into a short report to be presented to their classmates. They brainstorm unique ways to maintain Texas estuaries as well...
Curated OER
Computer Graphing
Students research the Internet or create surveys to find graphable data. They collect, organize, analyze and interpret the data. Finally, they choose the appropriate type of graph to display the data and find the measures of central...
Curated OER
Quadratic Function Graph
Learnerss engage in a study of quadratic functions and how the coefficient of x^2 has on the graph of it. They study the quadratic function for review with the help of index cards. The lesson includes a resource link to align the it with...
Curated OER
Electric Field Mapping in 3D
Students create a 3D vector field map of an electric field. In this physics lesson, students measure the voltage inside an aquarium with water. They present their findings and map to class..
Curated OER
Sand in Bottles
Eighth graders calculate the speed of bottles as they roll down a ramp with varying amounts of sand inside. Using their data, 8th graders estimate speed of three labeled bottles with different amounts of sand and compare those results...
Curated OER
Science: Coral Reef Food Pyramid
Learners construct numbers pyramids using fictional data from a coral reef. they tally the numbers of carnivores, herbivores, and producers. Students next build a pyramid shape in which they put their numbers of producers, herbivores,...


