National Security Agency
Line Plots: Frogs in Flight
Have a hopping good time teaching your class how to collect and graph data with this fun activity-based lesson series. Using the provided data taken from a frog jumping contest, children first work together creating a line plot of the...
Learning Games Lab
The Magic of Reading Graphs
Making conclusions from graphs doesn't need to seem like magic. Learners explore an interactive lesson on reading graphs to strengthen their skills. The content discusses how to read the axes of a graph and draw conclusions based on the...
Shodor Education Foundation
Graphit
No graphing calculator? No worries, there's an app for that! Young mathematicians use an app to graph functions. In addition, they can also plot data points.
Teach Engineering
Air Pollution in the Pacific Northwest
Scholars investigate levels of nitrogen dioxide in the Pacific Northwest by examining the role of nitrogen in air pollution and how remote sensing can be used to measure nitrogen levels. An Excel spreadsheet calculates the difference...
Kenan Fellows
Determining the Atomic Mass of Elements in a Compound Using Matrices
Scholars apply concepts learned in both Algebra II and Chemistry to answer the questions on the provided worksheet. The activity allows for extra practice in both classes and helps connect concepts usually taught in isolation. The...
University of Georgia
Endothermic and Exothermic Reactions
Equip your chemistry class with the tools to properly understand endothermic and exothermic reactions. Young chemists collect, analyze, and graph data to determine how the Law of Conservation of Matter is applied to chemical composition...
University of Georgia
Energy Content of Foods
Why do athletes load up on carbohydrates the evening before a competition? The lesson helps answer this question as it relates the type of food to the amount of energy it contains. After a discussion, scholars perform an experiment to...
Curated OER
Solar Heating in the Himalayas
A fascinating lesson plan on how solar power is utilized by people who live in the Himalayas is here for you. In it, learners perform a case study which will help them understand that solar energy is a renewable resource, that geography...
Curated OER
Glass Transition in a Rubber Ball
Learners illustrate the changes in the properties of a material at its glass transition point. They gather data which they use to construct graphs regarding elastic modules versus absorption modulus, tangent delta, and the effect of...
Curated OER
Air Pollution in Mexico City
A fantastic lesson on urban air pollution problems throughout the world is here for you. Learners understand that there are many factors involved in creating pollution, that there are many health effects brought on by air pollution, and...
Physics Classroom
A Wiggle in Time Lab
Though an alternative method is suggested, the best way to carry out this investigation is with the use of a computer-interfaced motion detector. Physics fanatics hang a mass on the end of a spring and analyze its motion verbally,...
Columbus City Schools
Speed Racers
Who wants to go fast? The answer? Your sixth-grade science superstars! The complete resource offers the ultimate, all-inclusive playbook for mastering the important concepts of speed versus time; distance versus time; and how to graph...
National Security Agency
Going Green with Graphs
For this unit designed for second graders, youngsters are introduced to conducting surveys and creating tally charts based on the data they gather. Students then construct bar graphs, and observe the relationships between the two types...
Chicago Botanic Garden
Plant Phenology Data Analysis
Beginning in 1851, Thoreau recorded the dates of the first spring blooms in Concord, and this data is helping scientists analyze climate change! The culminating instructional activity in the series of four has pupils graph and analyze...
Baylor College
Air: The Math Link
Inflate this unit on the science of air with these math skills practice and word problems. Accompanying the children's story Mr. Slaptail's Secret, this resource covers a wide range of math topics including the four basic operations,...
Polar Trec
How Much Data is Enough?
The next time you read a magazine or watch the news, make note of how many graphs you see because they are everywhere! Here, scholars collect, enter, and graph data using computers. The graphs are then analyzed to aid in discussion of...
Consortium for Ocean Leadership
Nannofossils Reveal Seafloor Spreading Truth
Spread the word about seafloor spreading! Junior geologists prove Albert Wegener right in an activity that combines data analysis and deep ocean exploration. Learners analyze and graph fossil sample data taken from sites along the...
G. Turrell
Science Activity 1: Light & Sound
Are you looking for lab sheets to go with your class experiment on plant response to light? You are no longer in the dark! This is a lesson that was written for a unit on light, but could easily be used to demonstrate plant behaviors in...
NOAA
A Matter of Density
Larvae transportation on the New England seamounts is based on the density of the water. Scholars calculate density and graph salinity versus temperature to better understand the distribution of organisms in a water column. Discussions...
Baylor College
Living Things and Their Needs: The Math Link
Enrich your study of living things with these cross-curricular math activities. Following along with the story Tillena Lou's Day in the Sun, learners will practice addition and subtraction, learn how to measure volume and length, work on...
Virginia Department of Education
Laboratory Safety and Skills
Avoiding lab safety rules will not give you super powers. The lesson opens with a demonstration of not following safety rules. Then, young chemists practice their lab safety while finding the mass of each item in a mixture and trying to...
NOAA
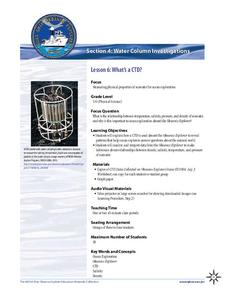
What's a CTD?
Why are the properties of the water important when exploring the ocean? Young scientists discover the tools and technology used in deep sea exploration in the fourth installment in a five-part series. Groups work together to examine...
Curated OER
What's in a Graph?
Students explore how to use and interpret graphs. The graphs are pulled from a variety of sources, and the activities ask students to interpret graphs. They start this lesson with knowledge of what a graph is. Students also know how to...
Teach Engineering
Complex Networks and Graphs
Show your class how engineers use graphs to understand large and complex systems. The resource provides the beginnings of graph theory by introducing the class to set theory, graphs, and degree distributions of a graph.


