Curated OER
Exploring Renewable Energy Through Graphs and Statistics
Ninth graders identify different sources of renewable and nonrenewable energy. In this math instructional activity, learners calculate their own carbon footprint based on the carbon dioxide they create daily. They use statistics to...
Curated OER
Wind Effects- A Case Study
Students explore hurricanes. In this weather data interpretation lesson, students draw conclusions about the impact of Hurricane Floyd as it related to weather conditions. Students read and interpret a tide data table, a barometric...
Curated OER
Trends of Snow Cover and Temperature in Alaska
Learners gather historical snow cover and temperature data from the MY NASA DATA Web site. They compare this data to data gathered using ground measurements from the ALISON Web site for Shageluk Lake. They graph both sets of data and...
Curated OER
In Touch with Apples
Students read "How To Make an Apple Pie and See the World", the story of a girl who traveled the world to find the ingredients to make her apple pie. They conduct a series of interdisciplinary activities including testing their senses,...
Virginia Department of Education
Thermochemistry: Heat and Chemical Changes
What makes particles attract? Here, learners engage in multiple activities that fully describe colligative properties and allow the ability to critically assess the importance of these properties in daily life. Young chemists...
Curated OER
Digestion & Nutrition: a Case Study
Students explore digestion/nutrition and utilize scientific investigation skills. They complete meal logs for several days and graph their results. After analyzing their data, they write formal lab reports.
Curated OER
Historical Pollution in the Hudson: Part 2
Ninth graders practice how to format and enter data into an Excel spreadsheet, make a graph, and interpret graphed data. They recognize how the pollution in the Hudson River has changed over time, and explain the consequences of these...
Curated OER
What's in the Water? - Stream Side Science
Here is a complete activity in which young biologists or ecologists test the pH, dissolved oxygen, turbidity and temperature of stream water. The class visits an actual stream and makes observations of the site. They use scientific...
Center for Learning in Action
Water—Changing States (Part 1)
Here is part one of a two-part lesson in which scholars investigate the changing states of water—liquid, solid, and gas. With grand conversation and up to three demonstrations, learners make predictions about what they think will happen...
PHET
Radiation Hazards in Space
Young scientists race from Earth to Mars and back, trying to complete mission objectives while avoiding radiation in this game for 2-4 players. To identify the winner, players must graph their mission points and radiation points at the...
Curated OER
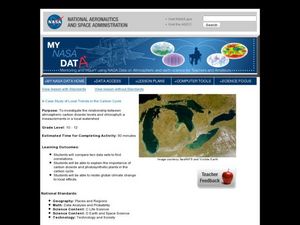
Case Study of Local Trends in the Carbon Cycle
Students examine the relationship between chlorophyll and carbon dioxide in the atmosphere. In this investigative instructional activity students study the local effects of climate change.
Curated OER
Where's the Water? Stream Side Science
After a whole-class discussion of water reservoirs, ten liters of water are given to each lab group to represent Earth's total amount of water. They divide the water into smaller containers, each representing one of those reservoirs. The...
Howard Hughes Medical Institute
Color Variation over Time in Rock Pocket Mouse Populations
A species-specific look at natural selection, the resource herein examines how adaptations have helped the population of rock pocket mice survive in a changing landscape. To begin, middle or high schoolers watch a 10.5 minute video,...
Curated OER
Dry Season and 'Green' Season in Costa Rica
Learners explore the seasonal changes in Costa Rica. In this dry season lesson students use the Internet to locate science data then generate data for precipitation.
Curated OER
Missing Macroinvertebrates - Stream Side Science
Field study groups collect samples of stream water and identify the macroinvertebrates found. Using their data, they calculate a water quality index to rate the health of the stream. They graph their data and discuss the value of a water...
Curated OER
That's Predictable - Stream Side Science
Research the impact that changes in biotic or abiotic factors might have on an ecosystem. Debate for or against the changes and take action in the community. This resource ideally follows stream studies that young ecologists may have...
Curated OER
Comparing Graphs of Temperature and Radiation
Students study plots and use a Live Access Server to generate plots. In this temperature activity students examine the process of incoming and outgoing radiation.
Earth Watch Institute
Entering Local Groundhog Data in an Excel Spreadsheet
Here is a cross-curricular ecology and technology lesson; your learners create spreadsheets depicting the location and number of groundhog dens in a local park. They research groundhogs and analyze data about where the groundhog...
Curated OER
Elastic Recoil in Arteries and Veins
A lab in which high schoolers examine the difference between arteries and veins. Budding biologists will find out which blood vessel can stretch furthest, recording their data in a table then answering several questions evaluating their...
Curated OER
Tides in the Hudson
Students view an illustration of the Hudson River watershed and identify the bodies of water shown. They discuss what happens when fresh and salt water mix. Students view a teacher demonstration of the stratification of fresh and salt...
University of Colorado
Spacecraft Speed
Space shuttles traveled around Earth at a speed of 17,500 miles per hour, way faster than trains, planes, or automobiles travel! In the 13th installment of 22, groups graph different speeds to show how quickly spacecraft move through...
NASA
Discovering the Milky Way
What do you call a tiny collection of galaxies? A puny-verse! Young scholars graph data gathered by scientists studying Cepheids. They attempt to identify a relationship between the variables through standard and logarithmical...
Rainforest Alliance
Forests of Guatemala
With 90 percent of its land area covered in forests, Suriname, a country in South America, contains the largest percentage of forests throughout the world. Here is an activity that brings classmates together to learn about the...
Discovery Education
Fuss About Dust
Dust is everywhere around us; it's unavoidable. But what exactly is dust and are certain locations dustier than others? These are the questions students try to answer in an interesting scientific investigation. Working independently or...


