Chicago Botanic Garden
Are Global CO2 Levels Changing?
According to the Mauna Loa observatory, carbon dioxide levels increased by 3 ppm in our atmosphere between 2015–2016. Individuals analyze carbon dioxide data from around the world and then share this with a home group in...
Space Awareness
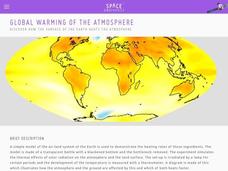
Global Warming of the Atmosphere
Scientists know the amount of carbon dioxide in the atmosphere today is higher than at any point in the last 800,000 years. Scholars learn about the amount of thermic radiation absorbed by air and what happens to the rest of the...
Howard Hughes Medical Institute
Lesson 8: WildCam Gorongosa Data Analysis
How do scientists analyze data to get a specific answer to a question? The final chapter in an eight-part series of activities centered around Gorongosa National Park encourages scholars to dig deeper into the scientific process. After...
Space Awareness
Greenhouse Effect
A greenhouse provides additional warmth and protection to the plants inside, but what if the greenhouse gets too hot? Pupils discuss and experiment with the difference between natural and anthropogenic greenhouse effect. They measure the...
Messenger Education
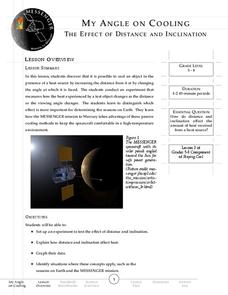
My Angle on Cooling—Effect of Distance and Inclination
When exploring Mars, spacecrafts are exposed to 5-11 times more sunlight than when near Earth. Groups of pupils complete a hands-on activity to explore how distance and angle of the sun affect temperature. Through discussions, they then...
University of Minnesota
Motor Learning and Memory
What do our brains have to do with reaction timing? Everything! In a hands-on learning activity, young scientists participate in four card activities that measure reaction timing. Each activity gets progressively more complex, and...
Curated OER
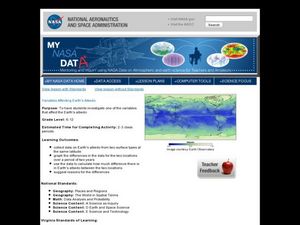
Variables Affecting Earth's Albedo
Students study the variables that affect the Earth's albedo. In this environmental data analysis lesson students interpret and graph information and calculate changes.
Curated OER
To Recycle, or Not Recycle?
To recycle or not to recycle, that is the question. Your class can find the answer by taking a teacher created WebQuest, where they assume a role of a community member taking a stand on implementing a community wide recycling plan. The...
Curated OER
Student News And Weather Channel
Fabulous! Your 5th graders should love this project. As an ongoing instructional activity throughout the year students use temperature probes to record outside temperature and then document their data using spreadsheets. They use their...
Cheetah Outreach
Population Change
Your youngsters become cheetahs in search of food, water, shelter, and space in a fun physical game that does a fantastic job of representing fluctuating species population based on resources available over years.
Curated OER
Games on Echolocation
Get a little batty with life science! This fun simulation game replicates how bats use echolocation to hunt moths in their native Hawaiian habitat. After creating blind folds and discussing some basic principles of echolocation, students...
Curated OER
"Lettuce" Learn About the Water Cycle
Young scientists investigate the water cycle through a lettuce seed experiment. For this experiment, learners plant lettuce seeds inside of a ziplock bag in order to create a small greenhouse. They observe condensation and precipitation,...
Curated OER
Learning to Make Line Graphs
Students analyze data and create a line graph. In this graphing lesson, students explore data from a previous experiment and plot the information on a line graph. Students analyze their findings.
Curated OER
Exploring Graphs
Students are introduced to connecting graphing in a coordinate plane to making scatterplots on a graphing calculator. Working in pairs, they connect points plotted to make a sailboat and complete questions on a worksheet as well as plot...
Curated OER
Re-Presenting Race in the Digital Age
Teen-aged scientists analyze a graphic organizer of how trash is removed from New York City and then answer standard questions about a graph and a diagram. Resources are mentioned, but there are no links to these resources, so you will...
Curated OER
Graphing And Data Presentation
Students engage in a study of science and mathematics with the practice of creating graphs. A guest speaker comes to the class to share statistics from the community and the students are shown how he uses the coordinate system in the...
Curated OER
Beary O'Mometer Learns About Careers In Meteorology
Students explore the field of meteorology. In this meteorology lesson plan, students explore weather-related careers as they research the field of study as well as various weather concepts. Students interview meteorologists, write...
Curated OER
Discovering Mitosis in Onion Roots
Students discover the different stages of mitosis by examining onion roots under a microscope, drawing diagrams of what they see, and organizing collected data in a chart and create a pie graph from their lab data.
National Nanotechnology Infrastructure Network
The Effects of Gold and Silver Nanoparticles on Brine Shrimp: A Toxicology Study
Who doesn't love gold and silver? Brine shrimp, that's who! Learners conduct an experimental lesson to monitor the toxicity of gold and silver nanoparticles on brine shrimp. They synthesize solutions to expose the brine shrimp to and...
PBS
Light Curves of Kepler's First Five Discoveries
The Kepler missions discovered and confirmed more than 2,650 exoplanets to date. A video shares the data from the first five discoveries. It provides graphs and diagrams to put each discovery in perspective to help scholars discuss the...
Virginia Department of Education
Heat Loss from a Fur-Insulated Animal
How do animals adapt to weather changes? Provide your class with the ability to understand adaptations and body temperature as they participate in this hands on experiment, using fake fur and hot water. Pupils collect data and...
Alabama Learning Exchange
Jelly Beans Add Up
Students explore counting, sorting, and graphing skills. In this data analysis lesson plan, students sort jelly beans by color, count the jelly beans, and create a bar graph of the jelly beans according to color.
Curated OER
Earth Science
In this earth science worksheet students complete a series of multiple choice and short answer questions on the different moon phases, gravitational pull and the earths layers.
Curated OER
Learning in Cockroaches
Students make scientific observations. In this stimulus response instructional activity, students make observations and collect data to determine if cockroaches can learn. A secondary purpose of this instructional activity is to provide...


