Curated OER
Data Management and Probability: Applications
In this data management and probability applications worksheet, 8th graders solve 20 various types of probability problems. They find the mean, median, mode and range of various numbers. Then, students use the spinner illustration to...
Mathematics Assessment Project
Middle School Mathematics Test 6
A thorough math test divides the content into two 40-minutes sections, covering material through algebra and geometry. Problems incorporate analysis and applied problem solving.
Howard County Schools
Exponential Decay Exploration
How can you model exponential decay? Explore different situations involving exponential decay functions and decreasing linear functions by performing activities with MandM candy, popcorn kernels, and number cubes.
Curated OER
Introduction to Scatter Plots and Correlation
Students examine the concept of scatter plots. They compare baseball statistics to locate the ones that correlate with winning, and identify the positive, negative, and no correlation in sets of data using MS Excel.
Curated OER
What's The Teacher's Choice?
Fifth graders explore how to use data and display it using a chart or graph. They use food choices for categories and then gather the data and use the provided chart for display. In small groups students discuss the data and the results.
Curated OER
Raisin the Statistical Roof
Use a box of raisins to help introduce the concept of data analysis. Learners collect, analyze and display their data using a variety of methods. The included worksheet takes them through a step-by-step analysis process and graphing.
Curated OER
China's Population Growth
Learners collect data from China's population growth and determine the mean, median, and mode from the data. In this data lesson plan, pupils determine probabilities and use them to make predictions.
Curated OER
Radioactive Decay
Students generate a radioactive decay table for an imaginary element, use their data to plot a decay graph, develop the concept of half-life, and use the graph to "age" several samples.
Howard Hughes Medical Institute
Color Variation over Time in Rock Pocket Mouse Populations
A species-specific look at natural selection, the resource herein examines how adaptations have helped the population of rock pocket mice survive in a changing landscape. To begin, middle or high schoolers watch a 10.5 minute video,...
Tech Museum of Innovation
Human Body Exhibit
Explore human anatomy and physiology using models. Scholars study systems of the human body and design a display for a museum exhibit. To complete the activity, individuals create analogous models of their chosen human body systems.
Illustrative Mathematics
Art Class, Assessment Variation
Play with paint and decide the ratio to make different shades of green. When mixing paint colors, your painters should decide which ratios make the same shade and what is needed to mix other ratios for a different shade of green. This is...
Curated OER
Raising the Bar While Hogging the Ham (Radio That Is)
Learners create a bar graph that communicates an amount without the need to know the exact data, determine what scale to use to best represent the data and use their bar graph to persuade others.
Curated OER
Graphing and Analysis of Water Quality Reports
Students practice making graphs and interpreting them. They compare and contrast different sets of data. They use Microsoft Excel to create different types of graphs.
Curated OER
Get a Half Life!
Eighth graders use M&M's to experiment with data. They use a graphing calculator to determine the best equation for their data; linear, quadratic or exponential. They analyze the data to find the half-life of their M&M's.
Curated OER
Patterns, Relations, and Functions
Young scholars investigate the patterns of different data sets of numbers. They use critical thinking skills in order to find the missing numbers in any given set. This lesson helps to develop the skill of number sense.
Curated OER
The Hot Dog Stand
Learners run a computer simulation. They collect data as they work and use the data to create an annual report for their business. Several different simulations could be used for this project. It is desirable for students to do this...
Curated OER
Geometric Figures and Applications
High schoolers study geometric figures. They use graph paper or Geometer's Sketchpad to construct and decorate geometric shapes, and also create a 3-D polygon using construction paper and a given template.
Made by Educators
Sociological Methods
First year undergraduate sociology students can prepare for their exams with an application that provides practice questions in six categories: Quantitative and Qualitative Data, Sources of Data, Primary and Secondary Data, Positivism...
Curated OER
Stem-and-Leaf Plots
Seventh graders study steam-and-leaf plots. Given specific data, they create a stem-and-leaf plot . Students identify the mean, mode, range and median. Afterward, they review vocabulary words.
Curated OER
Statistics with State Names
Students analyze the number of times each letter in the alphabet is used in the names of the states. In this statistics lesson, students create a stem and leaf plot, box and whisker plot and a histogram to analyze their data.
Curated OER
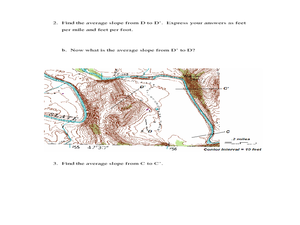
Slope and Topographic Maps
Students investigate slopes as they study topographic maps. In this algebra lesson, students discuss and apply the concept of slopes to graphing and analyzing data.
Curated OER
Celsius to Fahrenheit
Students convert degrees between two different units. In this algebra lesson, students graph linear equations and identify the line of best fit. They use their line of best fit to make predictions given a set of data.
Curated OER
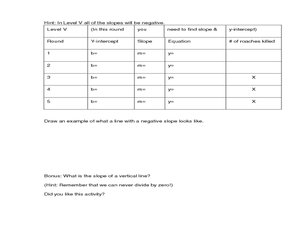
Cockroach Slope
Students identify the slope of linear functions. In this slope lesson, students collect data and graph it. They write equations with no more than two variables and use technology to explain their data.
Curated OER
Polly and the Shapeshifter
Students analyze the patterns in polygons and relate it to the rate of change. In this algebra lesson, students discuss the relationship between the data and the graph of the data.


