Curated OER
The Demographic Transition-A Contemporary Look at a Classic Model
Students evaluate and apply models to explain changes in global demographic patterns, and use their assessments to predict future needs.
Curated OER
Math: How Many Red M&Ms?
Sixth graders calculate the mean, median, and mode of candy M&Ms and find the percentage of each color. Once they complete the assignment, they compare their results with those of the candy company's percentages. As an extension,...
Curated OER
I am, and this is what makes me special
Students design a PowerPoint presentation using six slides that include a title, a picture and five positive attributes about the student. They include the specified pictures and describe how they relate to themselves.
Curated OER
Classification Introduction
Students simulate classifying rocks using different colored skittles. In this earth science activity, students create a Venn diagram according to their compiled information. They share this diagram in the class.
Curated OER
A Bar of Many Colors
Second graders use colored candies to collect data, construct double bar graphs, and find averages.
Curated OER
Atlantic Canada Report
Ninth graders create a report that will show an in-depth knowledge of the various geographical and climatic features of Atlantic Canada. They produce various items, on paper and using the computer, to demonstrate knowledge of outcomes,...
Curated OER
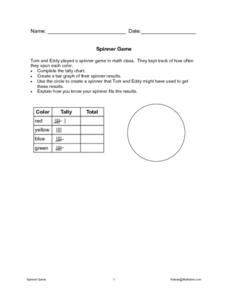
Math Spinner Game
In this math game worksheet, students complete a tally chart by filling in the "total" column of a graphic organizer. Students then create a spinner that might have been used to get the results shown and then explain how they know the...
Curated OER
Family Vacation
Young scholars use math to plan a trip by houseboat down the Mississippi River. They research and obtain information on the Mississippi River and its surroundings and use multiple graphs to represent their data.
Curated OER
Measurement: Stream Flow & Stadium Capacity
Eighth graders study the scientific fields and how information can be monitored and recorded. In this scientific inquiry lesson students view a PowerPoint presentation and complete a hands on activity.
Curated OER
M & M Candy: I Want Green
Eighth graders use colored candy pieces (such as M & M's) to compare mathematical expectations and experimental probability. They pick pieces of candy randomly, and graph their results. This classic activity never fails to engage...
Curated OER
Lesson Plan 2: Linear Inequalities
Students investigate linear inequalities and the associated symbols. After a teacher demonstration, they translate given phrases into symbols. Students solve and graph solutions to linear inequalities. Using newspapers, they locate...
Curated OER
Student Heights
Students measure the heights of their fellow classmates and create a box and whisker plot to display the data. In this measurement lesson plan, students analyze the data and record results.
Curated OER
Lesson Plan 3: Inequalities
Ninth graders study inequalities. After a teacher demonstration, classmates solve and graph inequality problems. In groups, they are assigned specific tasks that lead to the solving of inequality word problems.
Curated OER
Geography: Lengths, Perimeter, and Area of Similar Objects
Sixth graders explore characteristics of similar objects. Using attribute blocks, they explore the ratios of the perimeter, area and side length in similar shapes. They calculate and compare the area of shapes.
Curated OER
Patterns in Nature
Students learn about artist Larry Schulte and view examples of his work. They create addition sentence for the first seven numbers of the fibonacci sequence and use unifix cubes to build that sentences. Students color and create three...
Curated OER
Do You Live a Healthy Lifestyle?
Fifth graders examine and evaluate how active their own lifestyle is by counting how many steps they take on a daily basis. They watch a PowerPoint presentation about healthy lifestyles, record how many steps they take in a day with the...
Curated OER
If .... Then Probably
Learners are introduced to the concepts of probability and chance. Using data given to them, they organize and create a chart to display the information. Using this chart, they calculate the percentage of chance and probability and...
Curated OER
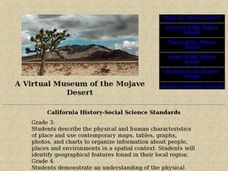
A Virtual Museum of the Mojave Desert
Students study deserts and the plants, animals, and people who inhabit them. In groups, they create their own stories about the inhabitants of the Mojave desert.
Curated OER
Range and Mode
In this graphing worksheet, 2nd graders focus on the range and the mode with the given data provided. Students study the chart and respond to four short answer questions.
Curated OER
Weather Conditions During the Spring Monarch Migration
High schoolers keep a detailed record of weather patterns during the spring migration of the monarch butterfly. The use of weather reports is used to form a class data sheet. This lesson connects to the skills of graphing and critical...
Curated OER
Berry Basket Painting
Students use plastic berry baskets to make different print designs with paint.
Curated OER
The M&M's Brand Chocolate Candies Counting Book
First graders use estimation skills and gather data and record their findings
Curated OER
Scientific Method for Middle Schools
Young scholars use the scientific method to solve a teacher scenario. They bring in M&M's. Students are given a copy of the scientific method. They first come up with a problem. Young scholars are told that they are going to conduct...
Curated OER
How Many M&M's
Students explore sets and collections. Students find the colors of M&M's and the amount of M&M's each student has. They organize this information into an Excel spreadsheet. Students use the chart wizard to create a graph.


