Curated OER
My Peanut Butter is Better Than Yours!
Students explore the concept of statistical data. In this statistical data lesson plan, students read an article about the dangers of peanut butter to those who are allergic. Students perform a taste test of two different brands of...
Curated OER
Academic Algebra II 1st Semester Exam
In the semester exam, learners solve problems dealing the the discriminant of quadratic equations, systems of equations, linear equations and inequalities. Students also simplify radicals, complete squares, and find the inverse of a...
Curated OER
Water: On the Surface and in the Ground
Students explore the differences between surface water and ground water. They collect data using maps and graphs and investigate a Texas river basin and a nearby aquifer. They complete a written report including maps and data regarding...
Curated OER
Lesson Plan On Fran Data
Seventh graders investigate the concept of functions and how they are used in the context of the real world while identifying the dependent and independent variables. They graph relations and functions and find the zeros of functions....
Curated OER
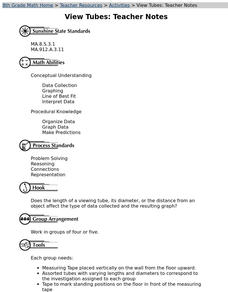
View Tubes
Eighth graders decide if the length of a viewing tube, its diameter, or the distance from an object affects the type of data collected and the resulting graph through a series of experiments.
Curated OER
Water-Is There Going to be Enough?
Students research the availability, usage and demand for water in the local area historically and use projections of the availability, usage and demand for water up to the year 2050. They gather data and present the information in...
University of North Texas
Math Exam 1 Review
Perfect as a review guide, this learning exercise provides a range of questions focusing on functions. Topics include composing functions, transformations, domains, and polynomials. Also included are corresponding worksheets focusing on...
Virginia Department of Education
Linear Curve of Best Fit
Is foot length to forearm length a linear association? The class collects data of fellow scholars' foot length and the length of their forearms. They plot the data and find a line of best fit. Using that line, they make predictions of...
Willow Tree
Approximating a Line of Best Fit
You may be able to see patterns visually, but mathematics quantifies them. Here learners find correlation in scatterplots and write equations to represent that relationship. They fit a line to the data, find two points on the line, and...
101 Questions
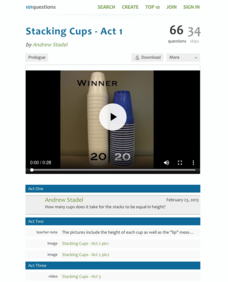
Stacking Cups
Facilitate an understanding of equality using a modeling task. After watching different-sized cups being stacked, learners use their math skills to determine when the height of each cup tower will be the same. Meant as an introduction to...
Virginia Department of Education
Exponential Modeling
Investigate exponential growth and decay. A set of six activities has pupils collecting and researching data in a variety of situations involving exponential relationships. They model these situations with exponential functions and solve...
Curated OER
Forms of Equations
Ninth graders discuss the different forms of equations. In this algebra lesson, 9th graders talk about the pros and cons of algebraic equations. They discuss reflection across the x and y axis and write out the equation of the given...
Curated OER
Activity One Teacher Page: Vehicles In Motion
Students identify variables that affect the system, and specify which variables are independent and which are dependent.
Curated OER
Applying Properties to Variables
Eighth graders combine like terms in this properties of variables lesson plan. Using named items (stars, moons and hearts), they combine like terms using variables. They use the distributive property to combine like terms. Finally, they...
Curated OER
Linear and Exponential Models
Students investigate the differences between linear and exponential models. In this linear and exponential models lesson, students make a table of given data. Students determine if the data is linear or exponential by plotting the data...
West Contra Costa Unified School District
Standard Form of Conics
Looking for a complete go-to guide for the standard form of conics? This five-page packet does a nice job of connecting conics to prior knowledge of functions and transformations. Adapt the resource as Algebra II lesson plan notes, or...
Virginia Department of Education
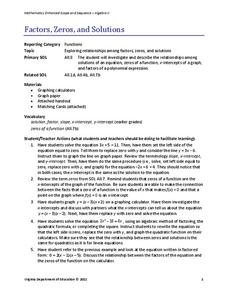
Factors, Zeros, and Solutions
Factors, zeros, and solutions, oh my! Don't let your classes become overwhelmed with the vocabulary. An engaging lesson helps learners make a connection between factors, zeros, and solutions. Pupils explore the relationship between the...
Virginia Department of Education
Determining Direct Variation
Once learners realize what direct variation is, they see it's just a type of linear function. The lesson poses a general question that leads to the creation of the y = kx formula. The resource includes discussion prompts and ideas for...
Curated OER
Kinetics of acetone iodination
For this chemistry worksheet, young scholars examine the given concept in order to apply in the laboratory setting. The sheet includes in depth background information.
Curated OER
Writing Equations
Pupils write linear equations. In this algebra lesson, students are given information and asked to write an equation. They solve real world problems apply concepts of linear equations.
Curated OER
Carshop!
Students explore the concept of interest. In this interest instructional activity, students shop for cars and determine the payments and interest rates for various cars. Students use various websites to research cars and interest rates...
Curated OER
Line of Best Fit
Students identify the line of best fit. In this statistics lesson, students collect and analyze data. They calculate the regression equations and identify the different types of correlation.
Curated OER
Cryptography Implementation
Pupils explore cryptology. They write a research paper on cryptography. Using linear equations, students invent a code and write a secret message. Pupils complete cryptography puzzles.
Curated OER
Technology - Chaos Theory Lab
Ninth graders gain an understanding of Chaos Theory that exists in one's everyday environment.
Other popular searches
- Graphing Slope Intercept Form
- Slope Intercept Graphing
- Slope Y Intercept Graphing
- Slope Intercept Graphing


