Curated OER
Make Your Fortune in Stocks
Fourth graders participate in a stock investment activity in which they research stocks to place in an imaginary portfolio. They invest $10,000 in a variety of stocks and track their progress using the Internet or newspapers.
Willow Tree
Line Graphs
Some data just doesn't follow a straight path. Learners use line graphs to represent data that changes over time. They use the graphs to analyze the data and make conclusions.
Curated OER
The Stock Market Game
Students explore the stock market. They choose a company and research the company's financial report. Students select 4-10 stocks and become an advocate for one stock. Using spreadsheet software, students compare stocks. They analyze...
Curated OER
The Stock Market Game
Students participate in a variety of stock market games within their classmates. They study the concepts of stocks and investments as well as the criteria for selecting of stocks. Each student is shown how to keep track of the progress...
Curated OER
Stock Market Game
Fourth graders are introduced to how the stock market operates. In groups, they practice reading and analyzing the Standard and Poor's 500 index. They participate in a simulation of buying and selling stocks on the market trying to...
Curated OER
Interpreting Line Graphs
Fifth graders interpret line graphs. In this graphing lesson, 5th graders first begin by reviewing the difference in bar and line graphs and what they are used for. Students practice interpreting the data on various line graphs and using...
Curated OER
Using a spreadsheet and the Internet to learn about stock market performance
Students record the progress weekly of a business of their choice on the stock market, graph those results, research and report on current news and how it pertains to the companies recent performance.
Curated OER
Stocking Up
Eighth graders are trained to be brokers and to buy and sell stocks. Each group is allotted $1000. Team members work together within their groups to build a stock market portfolio and track the stocks they own.
Anti-Defamation League
Sixty Years Later
Has any progress been made in desegregating schools since 1954's Supreme Court case Brown v. Board of Education? To find out, class members examine charts and graphs representing U.S. schools' racial, ethnic, and socioeconomic...
Curated OER
Exploring the Stock Market
Students explore their options in stocks. For this algebra lesson, students create a portfolio for their future in stocks. they discuss their choices with a broker and presents their portfolio to the class.
Curated OER
Plotting Data on a Graph
Young scholars investigate graphing. For this graphing lesson, students survey the class and create graphs to reflect the data collected.
Curated OER
Exploring Linear Equations And Scatter Plots - Chapter 5 Review
Young scholars complete rolling stocks experiment, and collect and enter data on the computer. They enter data on graphing calculators, complete scatter plot by hand with line of best fit, and discuss different graphing methods.
Curated OER
Investing Money
Sixth graders participate in an simulated investment activity. They examine the purpose of different types of investments before they predict which will be the most successful. Finally, they simulate investing $1,000 in stocks, $1,000 in...
Curated OER
The Stock Exchange Phase I
Second graders select a stock and follow its ups and downs, using graphs to show its success.
Curated OER
Following the Stock Market With a Palm
Young scholars research and explore the stock market. They research a three-year history of stocks, develop a group and individual spreadsheets, and follow their stocks and prices for a ten-day period, graphing the results.
Curated OER
Stock Reports
Learners spend $10,000 by picking up to 3 stocks in which to invest. They monitor their progress for three weeks, and chart results in a spreadsheet template.
Curated OER
The Stock Exchange Phase III
Seventh graders use information from the stock exchange, to create a multimedia presentation and present it to the class. This lesson teaches communication and technology skills.
Curated OER
Researching Stocks on New York Stock Exchange
Sixth graders research to find background information and stock history over the last year about a company listed on the NYSE. They evaluate whether or not they should "invest" in that company. They write a persuasive essay outlining...
Curated OER
The Notorious Four-Color Problem
Take a walk through time, 1852 to 2005, following the mathematical history, development, and solution of the Four-Color Theorem. Learners take on the role of cartographers to study a United States map that is to be colored. One rule: no...
Curated OER
Buy Low, Sell High
Students investigate the stock market and investing in corporate stocks by creating an investment portfolio. They develop database worksheets that track their stock's performance over a specified period of time. Students use their...
Curated OER
The Stock Market-Tracking and Picking Stocks
Students interpret the stock market. They pick preferable stocks based on price to earnings ratios listed in the quotes. They practice using fractions and decimals to calculate the cost of selling and buying various stocks using...
Curated OER
Data Analysis: bird habitats in rice farms
Fifth graders make a graph and write an essay to interpret the data of birds that take advantage of habitats near rice farms. In this data lesson plan, 5th graders calculate the information given to them and interpret it in an essay form.
Curated OER
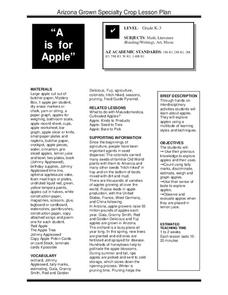
A is for Apple
Students participate in a variety of activities to learn about apples. Students graph apples, learn about apple uses, taste apples, and observe what happens when apples are dipped in lemon juice.
Curated OER
Tallies Tell It All
Students explore data collection through the use of tally marks. After a demonstration of the use of tally marks students complete various inquires where they create a chart documenting the number of times a desired result happens. They...


