Curated OER
Lesson 3: Graphing Ordered Pairs on a Coordinate Plane
Students study how to graph ordered pairs on a coordinate plane. After a teacher demonstration, students work together to complete problems. They explain and share their answers. As an activity, they solve a mystery story about the...
Curated OER
Line Graphs
Seventh graders create a line graph and identify when to use line graphs. In this line graphs lesson, 7th graders analyze the average temperatures of various cities. Students graph the data they collected.
Curated OER
A Day at the Beach
Help learners determine the rate of change for the temperature of sand. They will collect data on the temperature of wet and dry sand over time with a heat lamp overhead. Then make a scatter plot of the data and find a linear model to...
Computer Science Unplugged
Tourist Town—Dominating Sets
As an introduction to using a network to determine the fewest number of nodes that meet a given condition, small groups work together to determine the fewest number of ice cream vans, and their locations, to be able to serve the people...
Howard County Schools
To Babysit or Not to Babysit?
Would you work for a penny today? Use this activity to highlight the pattern of increase in an exponential function. Scholars compare two options of being paid: one linear and one exponential. Depending on the number of days worked, they...
Curated OER
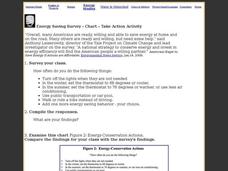
Energy Saving Survey - Chart - Take Action Activity
In this saving energy activity, students survey the class about saving energy, examine an energy chart, and answer short answer questions. Students complete 4 tasks.
Curated OER
Where Did We Go on Holiday This Year?
In this differentiated whole-group activity worksheet, students list all the places they visited over the summer, record the places on a flip chart, calculate the distances on a road map and graph the data they collect.
Curated OER
Skittles, Taste the Rainbow
Fifth graders learn and then demonstrate their knowledge of a bar and a circle graph using the classroom data. Students are given a pack of skittles candy. Students create a bar and circle graph indicating the results of the contents of...
Curated OER
Heart to Heart
Students predict the outcome of a question and conduct a survey and record their findings on a bar graph.
Curated OER
Graphing Sunspot Cycles
Students explore sunspots and then graph them to analyze the data. In this sunspot cycles lesson students complete an activity sheet and complete questions.
Curated OER
Plotting Sunspot Activity
Students explore how to graph sunspots using a solar graph. In this sunspots lesson students investigate sunspots and complete and evaluation worksheet.
Curated OER
Too Much Oxygen or Too Little?
In this oxygen worksheet, students analyze date about the oxygen levels in a river to determine the cause of the dying fish. This worksheet has 2 graphs, 12 short answer questions, and 2 graphic organizers.
Curated OER
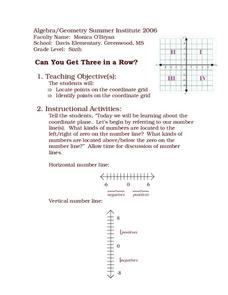
Three In a Row
Sixth graders examine how to locate coordinate points. In this coordinate graphing lesson plan, 6th graders locate the x and y axis. Students use their arms to show horizontal and vertical lines, participate in group and...
Curated OER
Illustrate the Constellations
Young scholars explore space science by participating in a star identification activity. In this astronomy lesson, students identify different star patterns and discuss the movement of stars across the sky as the seasons change. Young...
Curated OER
Graphing on a Coordinate Plane
Eighth graders explore the coordinate system. They identify the x and y-axis, parts of the coordinate plane, and discuss the process of plotting points. To emphasize the process of plotting points, 8th graders play an ordered pair...
Curated OER
Read, Recognize & Graph Integers
Students explore negative and positive integers on a number line. They review a newspaper to determine careers that use positive and negative integers. In groups, they read and answer questions on "Lifestyles of the Rich and...
Science 4 Inquiry
States and Phases of Matter
Plasma is the most common phase of matter in our universe. Scholars explore the change of energy as molecules change phases of matter. They rotate through stations, graphing the changes in energy level.
Curated OER
Convergence with The Cay: Exploring Geographic Concepts Wrapped in a Story
Here's an awesome unit that uses The Cay as the anchor text. The 16-page packet is loaded with teaching ideas, activities, and suggested adjustments.
Polar Trec
Who Will Melt First?
If the Greenland ice sheet melted, sea levels would rise by about 20 ft; if the Antarctic ice sheet melted, sea levels would rise by 200 ft. Scholars explore ice melting through the analysis of different ice samples, clean and dirty ice....
Curated OER
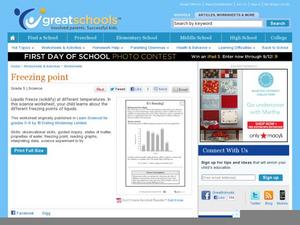
It's Freezing!
Here is a good worksheet for 5th grade scientists. In it, they look at a bar graph that shows the freezing point for a variety of liquids. Then, they are given a scenario of a certain liquid melting and freezing, and must determine which...
Curated OER
The Reason for the Seasons
Students compare graphs of their data that was generated on a NASA website. In this seasons lesson students complete a lab activity.
Illustrative Mathematics
Kimi and Jordan
Kimi and Jordan have taken summer jobs to supplement their weekly allowances. Kimi earns more per hour than Jordan, but Jordan's weekly allowance is greater. This activity asks students to determine how the incomes of the two workers...
Curated OER
Weather through the Seasons
Students examine the year's cycles by observing the four seasons, their distinctive weather patterns that affect our activities and the weather changes that each brings. The fourteen lessons of this unit offer a good opportunity for the...
Curated OER
Pie Graph
Fifth graders examine fractional parts of pie graphs. Given a bag of M&Ms, 5th graders interpret the data. They use a paper plate and colors to create a graph of the types of M&Ms represented.


