Curated OER
Using the TI-83 to Evaluate Sequences
In this evaluating sequences activity, learners use the TI-83 graphing calculator to evaluate sequences. Instructions on how to use the calculator with these type of problems is provided. There are three problems on this one-page...
Curated OER
Graphs of the Sine and Cosine Function
In this college level Pre-Calculus worksheet, students investigate the graphs of the sine and cosine functions. The six page worksheet contains seventy-eight problems. Solutions are not provided.
Curated OER
Number Line: Negative Numbers
In this graphing calculator learning exercise for the TI-83 calculator, students first observe a demonstration for calculating negative numbers. Next, students use their graphing calculator to answer 6 thoughtful T/F and short answer...
Curated OER
The "U's" Have IT!
Students explore the maximum and minimum values of parabola. In this exponential equations instructional activity, students use graphing calculators or TI Interactive Software to calculate values of parabola and graph x-intercepts of...
Curated OER
The Coordinate Plane
Use this Saxon math coordinate plane worksheet to have your learners utilize a graphing calculator, equate the vertices of a rectangle, and then graph their conclusions as well as answer a variety of fill in the blank equations.
Saxon
Plotting Functions
Youngsters use a graphing calculator to assist in creating a function table. They graph the function on a coordinate plane. They explore the relationship between the domain and range in the graph. This four-page instructional activity...
Curated OER
Another Way of Factoring
Focusing on this algebra activity, learners relate quadratic equations in factored form to their solutions and their graph from a number of different aspects. In some problems, one starts with the original equation and finds the...
Curated OER
Dependence of Light Intensity on Distance
Hopefully you have a sensor interface for your physics class to use with graphing calculators when collecting data with a light sensor. If so, read on. Use this resource for learners to predict and then test whether or not the intensity...
Curated OER
How Big Is The Playground?
Students calculate the standard and metric measurements of a playground. In this measurement lesson, students use GPS coordinates and graphing calculators to determine the dimensions of an area outside of the school in both standard and...
Charleston School District
Review Unit 6: Systems of Equations
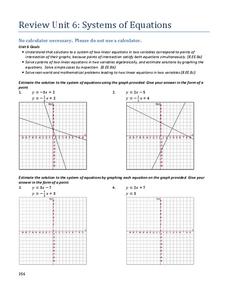
It's time to show off what they learned! The final lesson in the series is a review worksheet on the topics learned throughout the unit. Scholars solve systems of equations using graphic and algebraic methods, solve system-based word...
Curated OER
Matrix Madness!!
Perform operations to add, subtract, multiply and divide matrices. Then solve problems with vectors using matrices. A three day lesson: Matrix Madness, Mystical Matrices, and Decode the Encode. The last lesson has prizes that the class...
Teach Engineering
Determining Densities
Don't be dense—use a robust resource. The second installment of a five-part Floaters and Sinkers unit has learners determine the densities of several objects. As part of the activity, they learn the displacement method for finding...
Curated OER
Introduction to Graphical and Algebraic Inverses
Solve inverse functions through graphing and algebra. High schoolers will graph inverse functions and use the correct notation to write the equation. They observe a graph and write an equation for the function. In the end, they will be...
Fall River Schools
Parabolas Are All Around Us
Moving parabolas off of graph paper and into the real world is the task at hand in this detailed poster project. First, learners perform a cumulative activity identifying many characteristics of an assigned quadratic equation. Next, they...
Curated OER
Curve Ball
Create a Height-Time plot of a bouncing ball using a graphing calculator. Graph height as a function of time and identify the vertex form of a quadratic equation that is generated to describe the ball's motion. Finally, answer questions...
Curated OER
Explorations 5: Introduction to Limits
In this limit instructional activity, learners find the interval values of given functions. They identify constants, and plot graphs. This three-page instructional activity contains approximately 20 problems.
Curated OER
Systems of Equations and Real Life
What a great classroom resource! The intention of this lesson is to show that real-world math can and should be applied to the community in which your students reside. The class relates properties of equations to solving for species...
Curated OER
Building a Quadratic Function Form
Comparing the movement of graphs geometrically when small changes are made to the parent function motivates this collaborative discussion on the transformations of functions to their various forms. Vertical and horizontal shifts due to...
Curated OER
World of Work
Twelfth graders research want ads on the Internet or in the newspaper. They calculate the estimated weekly, monthly, and yearly pay for an hourly, salary and commission positions. They calculate a paycheck including state tax, federal...
Curated OER
Geometry: Translations and Reflections
Group work and participation is used to perform a specified translation or reflection. In this geometrical translation lesson, small groups of pupils are each given a shape to plot on a coordinate grid. Each shape is then translated or...
Curated OER
Time That Period
Physical science starters play with a pendulum in order to experience periodicity. Detailed procedures and a worksheet are included for day one. For day two, learners will use a graphing calculator to help them plot orbit data from a...
Curriculum Corner
8th Grade Math "I Can" Statement Posters
Clarify the Common Core standards for your eighth grade mathematicians with this series of classroom displays. By rewriting each standard as an achievable "I can" statement, these posters give students clear goals to work toward...
Curated OER
Linear Equations
Eighth and ninth graders solve and graph 42 different problems that include writing various equations and graphing them on a grid. First, they create a table for each equation and graph it on a grid locating the x-and y-intercepts. Then,...
Texas Instruments
Function Notation - Texas Instruments
Using a TI-Nspire calculator, learners will work to better understand function notation and input/output functions. They write equations with a function symbols, identify what makes an equation a function, and graph lines in order to...


